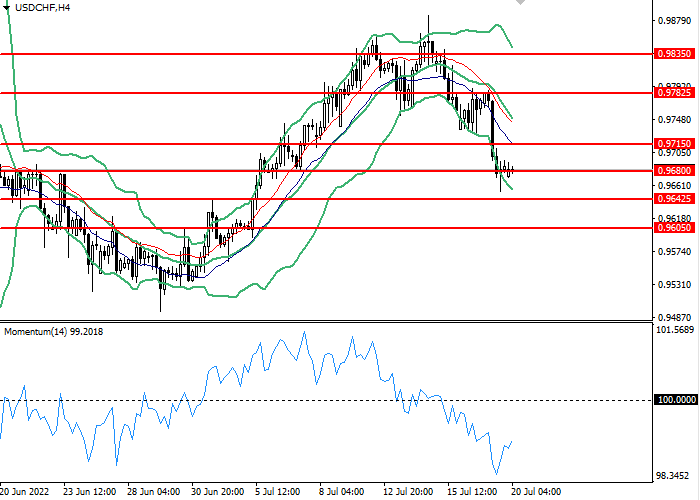
General analysis USDCHF for 20.07.2022
Current dynamics
The USD/CHF pair opened today's trading session with a decline. To continue the bearish performance of the pair for the third consecutive session. As the pair witnessed yesterday, Tuesday, a strong slide from the highest level in several weeks, touched last Thursday.
The US dollar continued its bearish path and extended its losses significantly during trading on Tuesday, with lower expectations of investors that the US Federal Reserve will tighten its monetary policy more strongly during its meeting next week, in light of the sharp decline in gasoline prices during the past month, a development that officials are likely to welcome. The Fed is concerned that expectations of high inflation may become ingrained and complicates their task of curbing price increases.
In addition to the statements of the Fed members that came to confirm that they are committed to raising the interest rate by 75 basis points in the current July meeting to reduce bets about the Federal Reserve escalating the pace of raising interest rates.
Whereas, Lewis Waller and James Bollader, Fed members said that they are leaning toward a 75 basis point rate increase at the next meeting, rather than a move by 100 basis points, to mitigate the negative effects on the economy.
As data published by the US Census Bureau on Tuesday, building permits came in at 1.685 million, above expectations (1.65 million) in June, and housing starts in the United States (MoM) came in at 1.559 million, below expectations (1.585 million) in June, the rate increased Building permits changed to -0.6% in June from the previous -7%. The initial housing change rate increased from -14.4% previously to -2% in June.
The main keys affecting the pair will be this week Initial Jobless Claims, and S&P Global Purchase Managers Index (PMI).
Support and resistance levels
On the 4 hour chart, the instrument is testing the consolidation at the bottom of the Bollinger Bands. The indicator is directed downward and the price range is widening, which indicates that the current trend is about to continue. The momentum chart is below the 100 level, which gives buy signals. The Envelopes indicator gives clear sell signals.
- Support levels: 0.96800, 0.96425, 0.96050.
- Resistance levels: 0.97150, 0.97825, 0.98350.
Trading scenarios
- Short positions should be opened at the 0.96800 with a target of 0.96425 and a stop loss at 0.97150. Implementation period: 1-2 days.
- Long positions can be opened above the level of 0.97150 with a target of 0.97825 and a stop-loss at the level of 0.96800. Implementation period: 1-2 days.
