Technical analysis WTI for 17.10.2024
۱۷.۱۰.۲۰۲۴ ۰۸:۳۹
داخل روز
تکنیکال
The Tenkan-sen line is located above the Kijun-sen line. Red is directed upwards, while blue remains horizontal. Confirmatory line Chikou Span is below the price chart. In this case, the cloud is descending. Instrument is traded between Tenkan-se and Kijun-sen lines. The closest support and resistance levels are Tenkan-se and Kijun-sen, respectively. The closest support and resistance levels are Kijun-sen and Tenkan-se, respectively
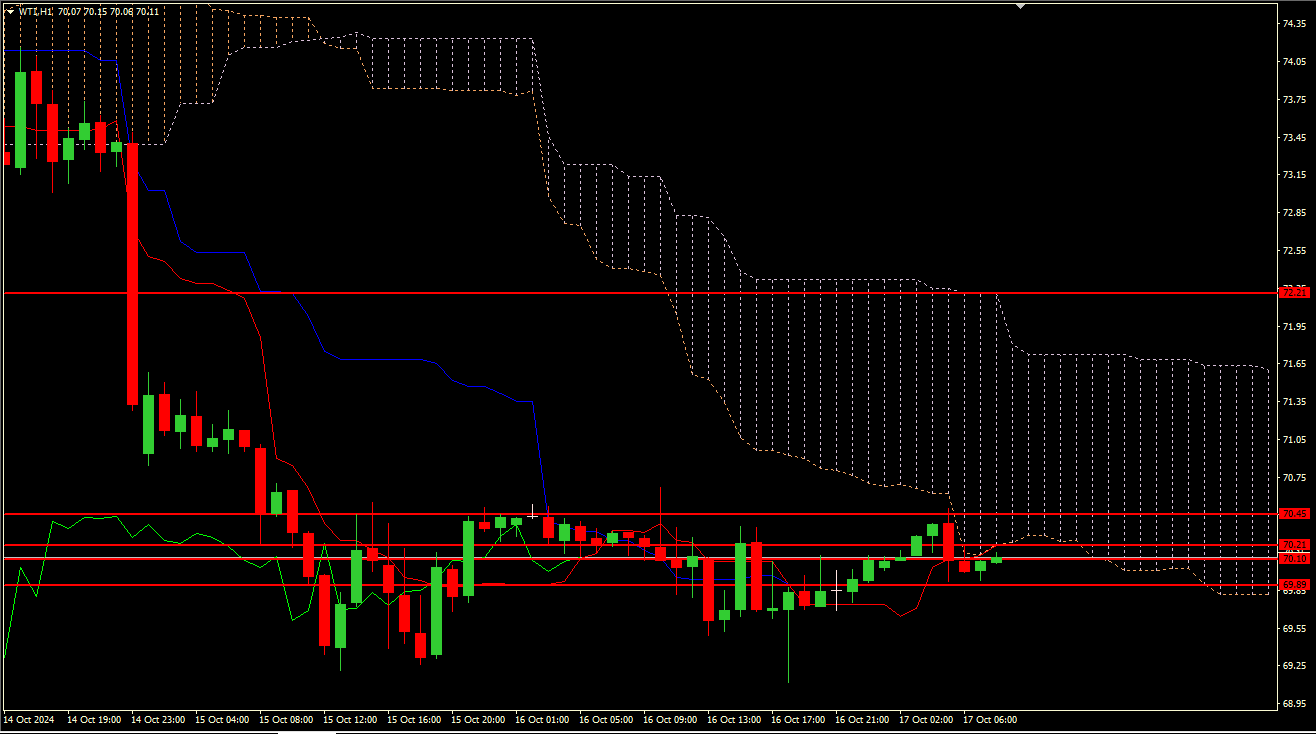
Key levels
69.89, 70.10, 70.21, 70.45, 72.21
Trading scenario
Recommended opening long positions (Buy Limit) from the level of 69.89, with Take Profit of 70.21 and Stop Loss of 69.55
Alternative scenario
Recommended opening long positions (Buy Stop) from the level of 70.20, with Take Profit of 72.21 and Stop Loss of 69.89
سناریو
Recommendation
BUY LIMIT
نقطه ورود
69.89
حد سود (TP)
70.21
حد ضرر
69.55
سطوح کلیدی
69.89, 70.10, 70.21, 70.45, 72.21
سناریوی جایگزین
Recommendation
BUY STOP
نقطه ورود
70.20
حد سود (TP)
72.21
حد ضرر
69.89