
Gold Price Forecast for Today, Tomorrow, Next Week, and 30-Day Forecast

Gold price forecast and analysis for today, tomorrow, next week and the next 30 days, including key technical levels and market drivers.
Gold is one of the most actively traded financial instruments because of its high liquidity and sensitivity to interest rates, the US dollar, inflation, and global risk. XAU/USD analysis helps traders assess the current market direction, key support and resistance levels, and potential price scenarios.
Key Takeaways
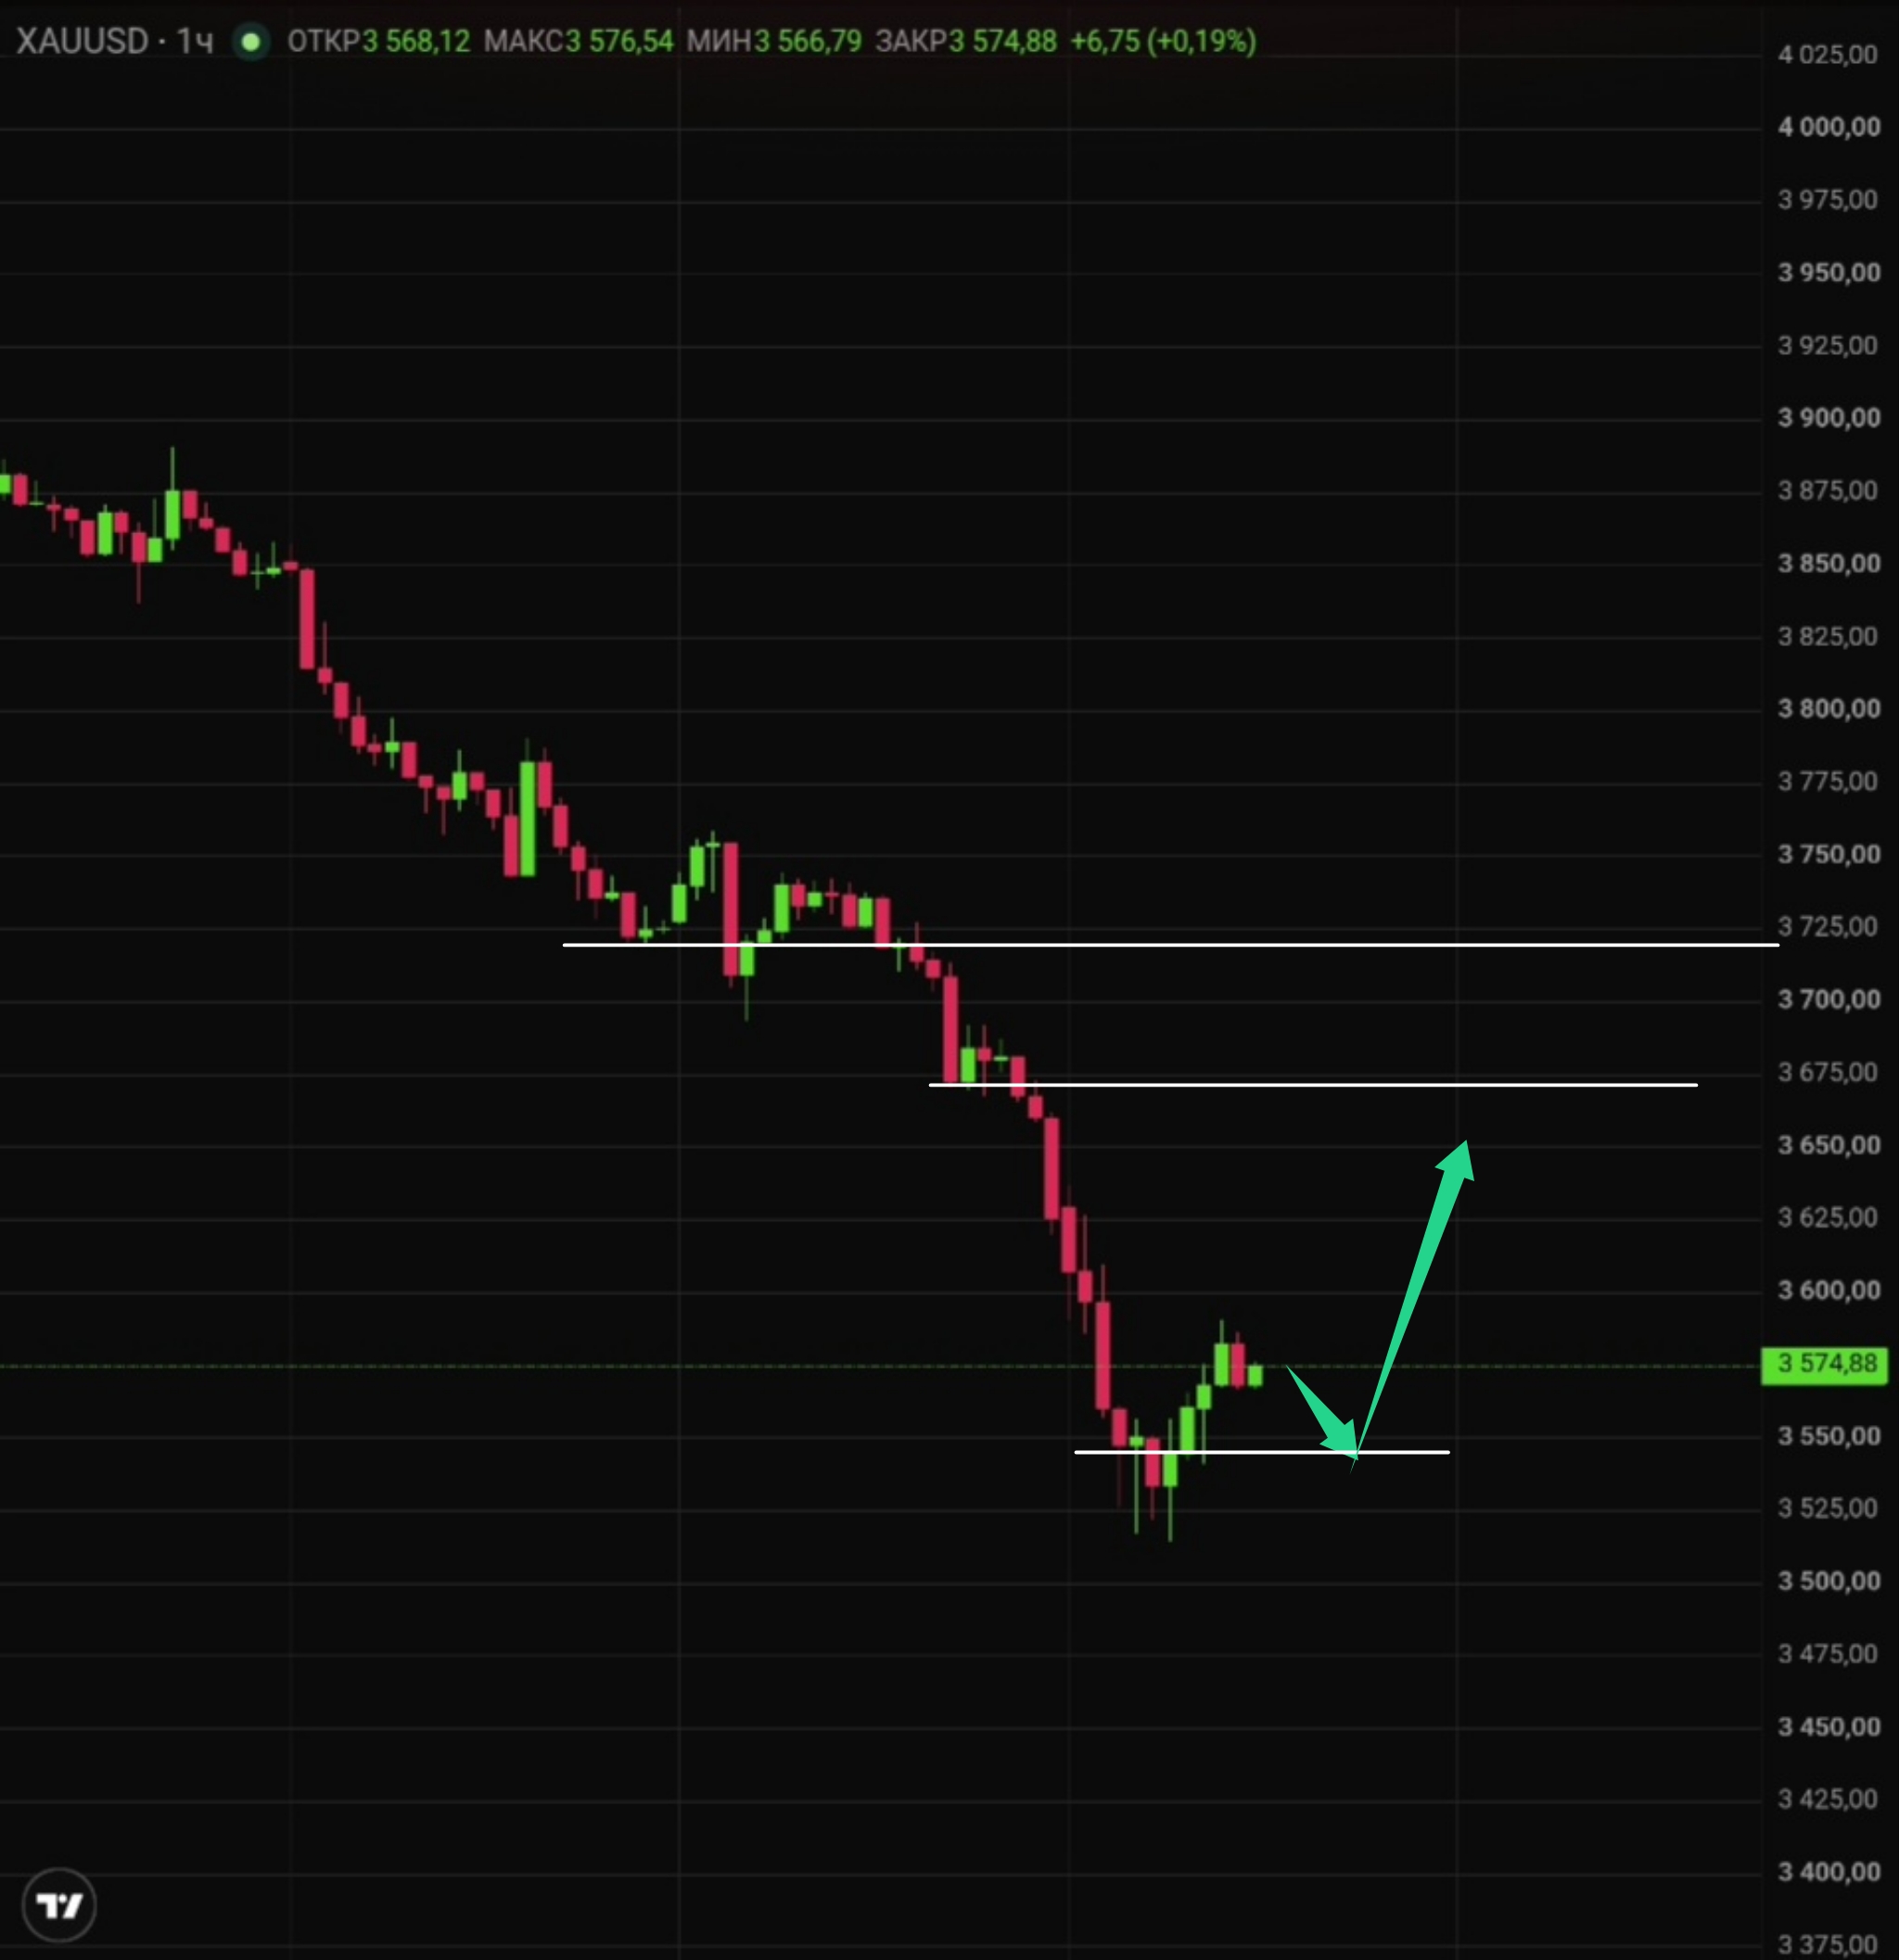
Intraday: Look for buy opportunities on dips toward the $3,550 demand zone, with a stop below $3,520. A clear hold above this area supports a rebound toward $3,650.
The base scenario: Recovery from $3,550 toward $3,650, followed by renewed selling pressure.
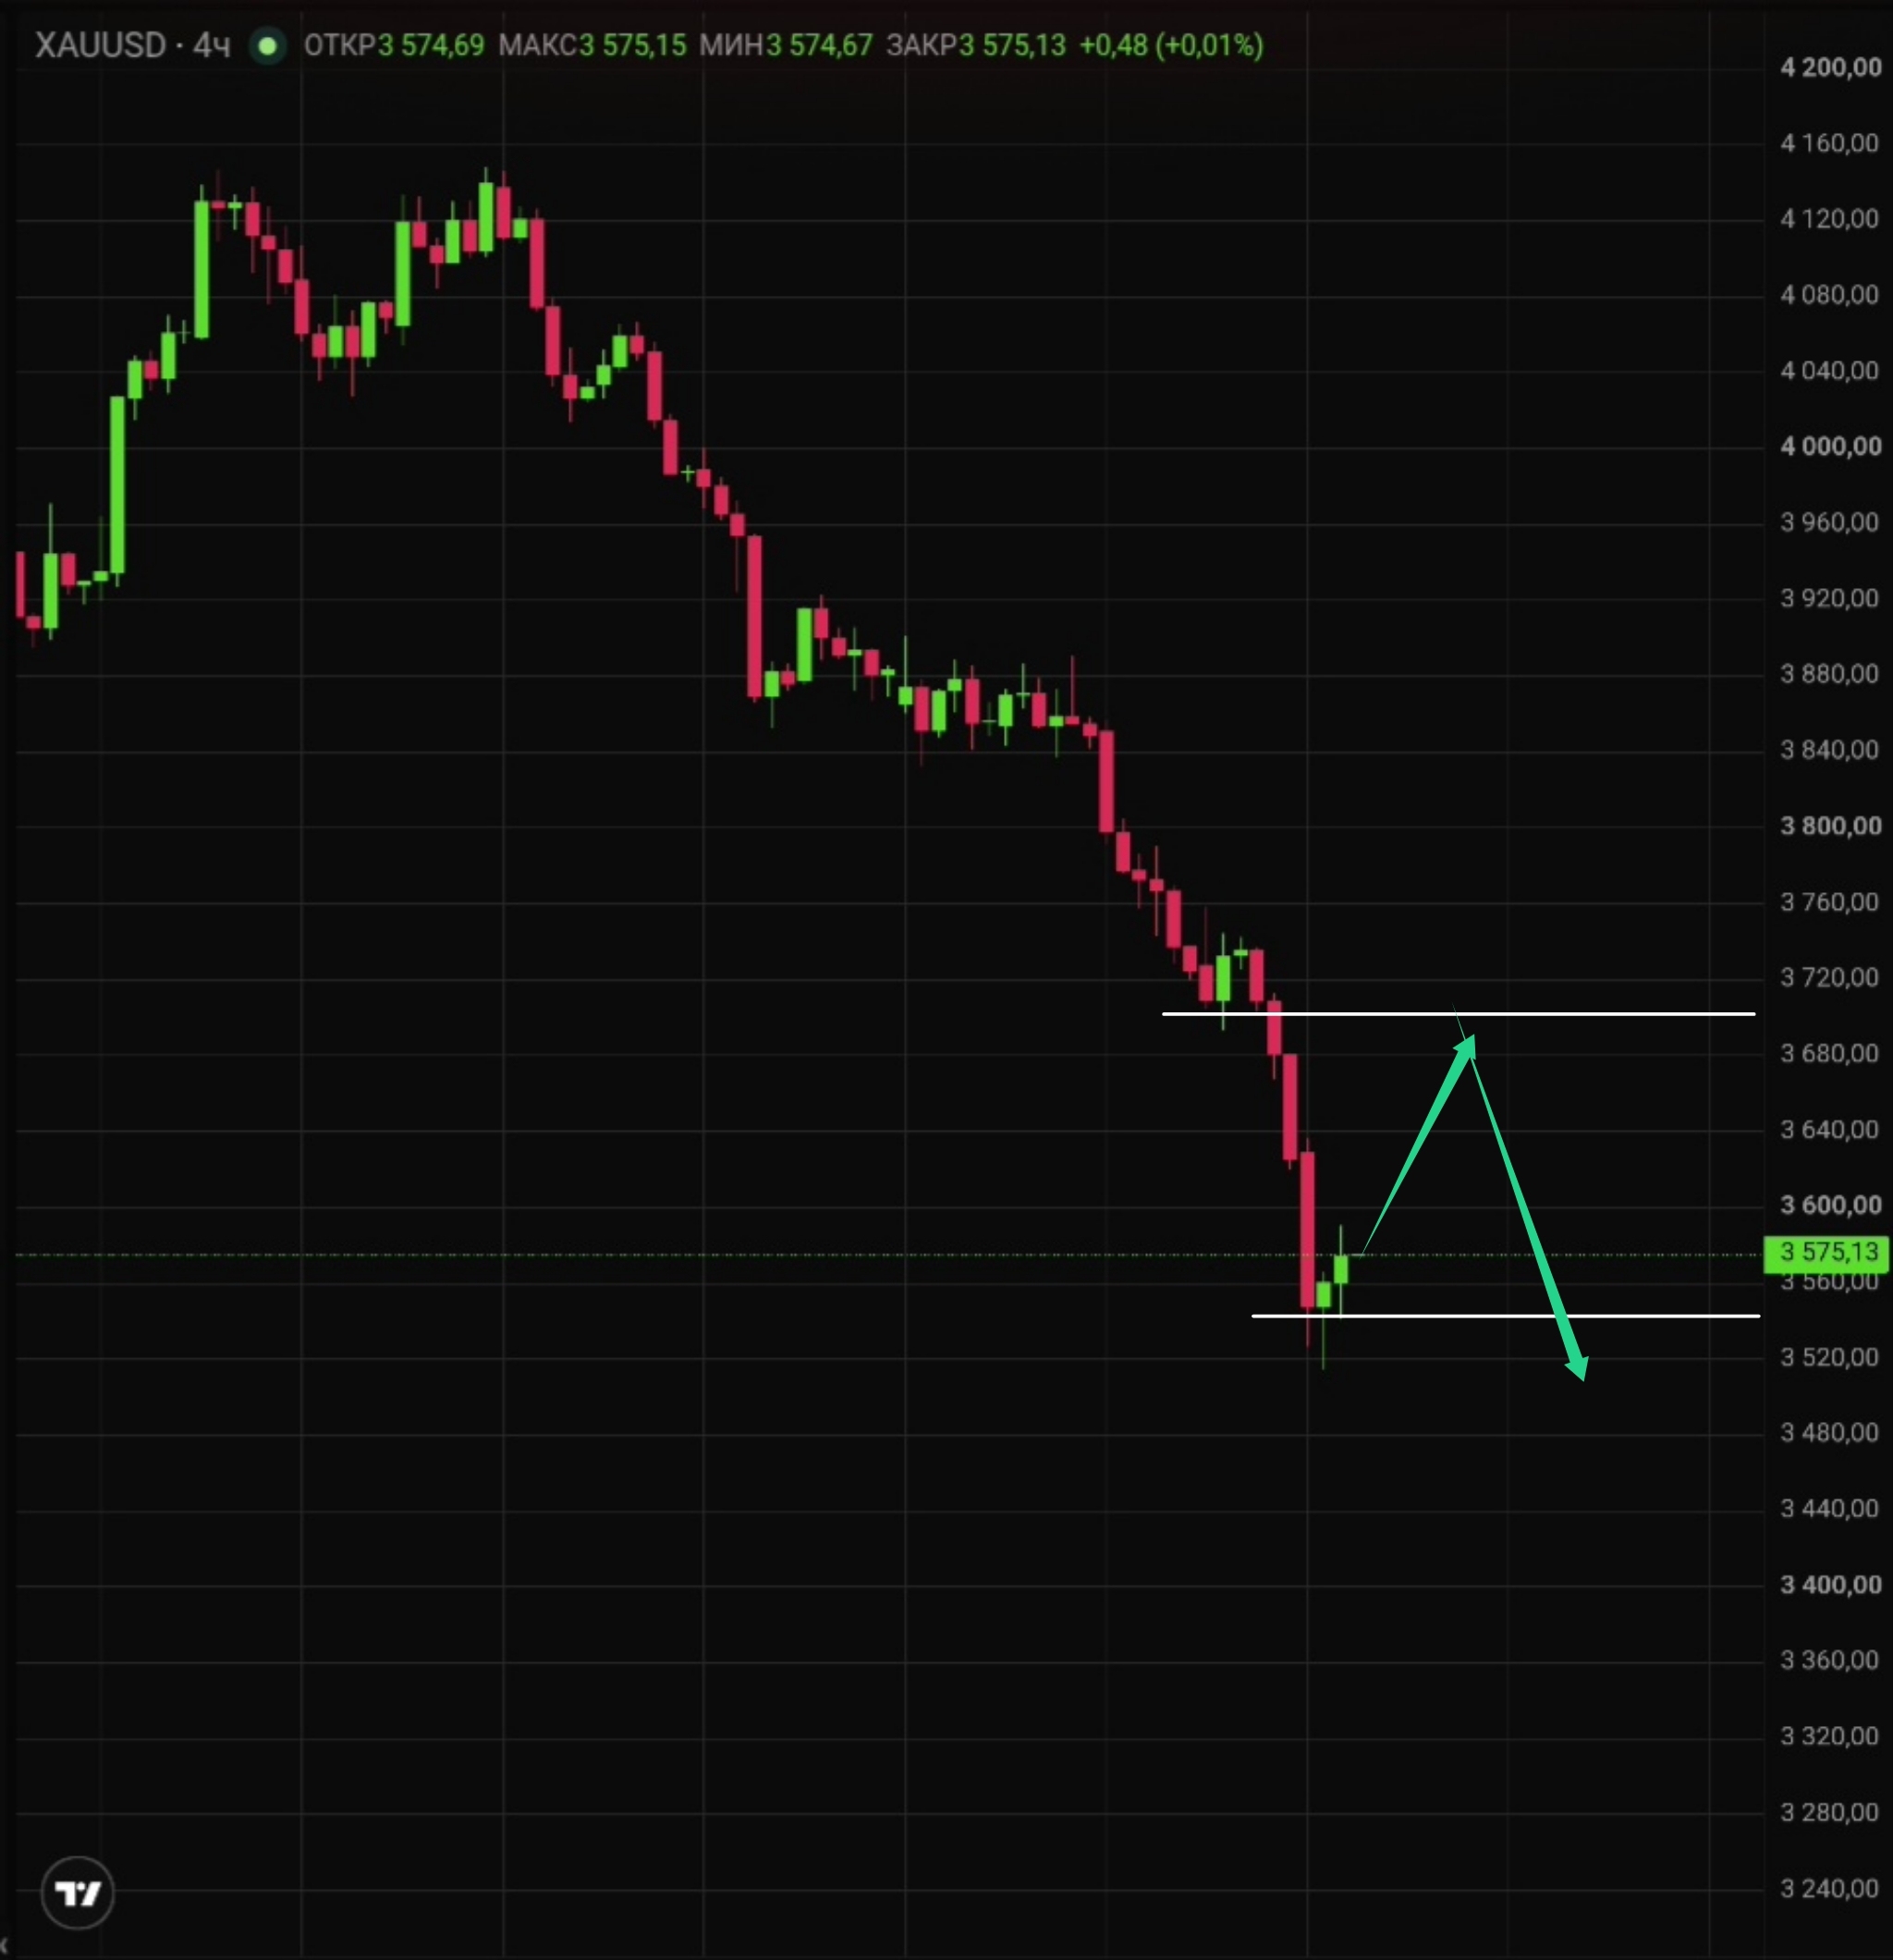
The alternative scenario: A stronger corrective move into the $3,680–3,700 area before sellers return.
This week: The fundamental bias remains bearish while markets price in a high probability of a December Fed rate hike. Strong U.S. data or firm Fed rhetoric would keep pressure on gold.
30-day outlook: Base case points to consolidation in the $3,500–3,700 zone. A sustained recovery above $4,000 would require a clear shift in Fed expectations, while a break below $3,500 opens deeper downside.
Latest Gold (XAU/USD) Technical Analysis for Today
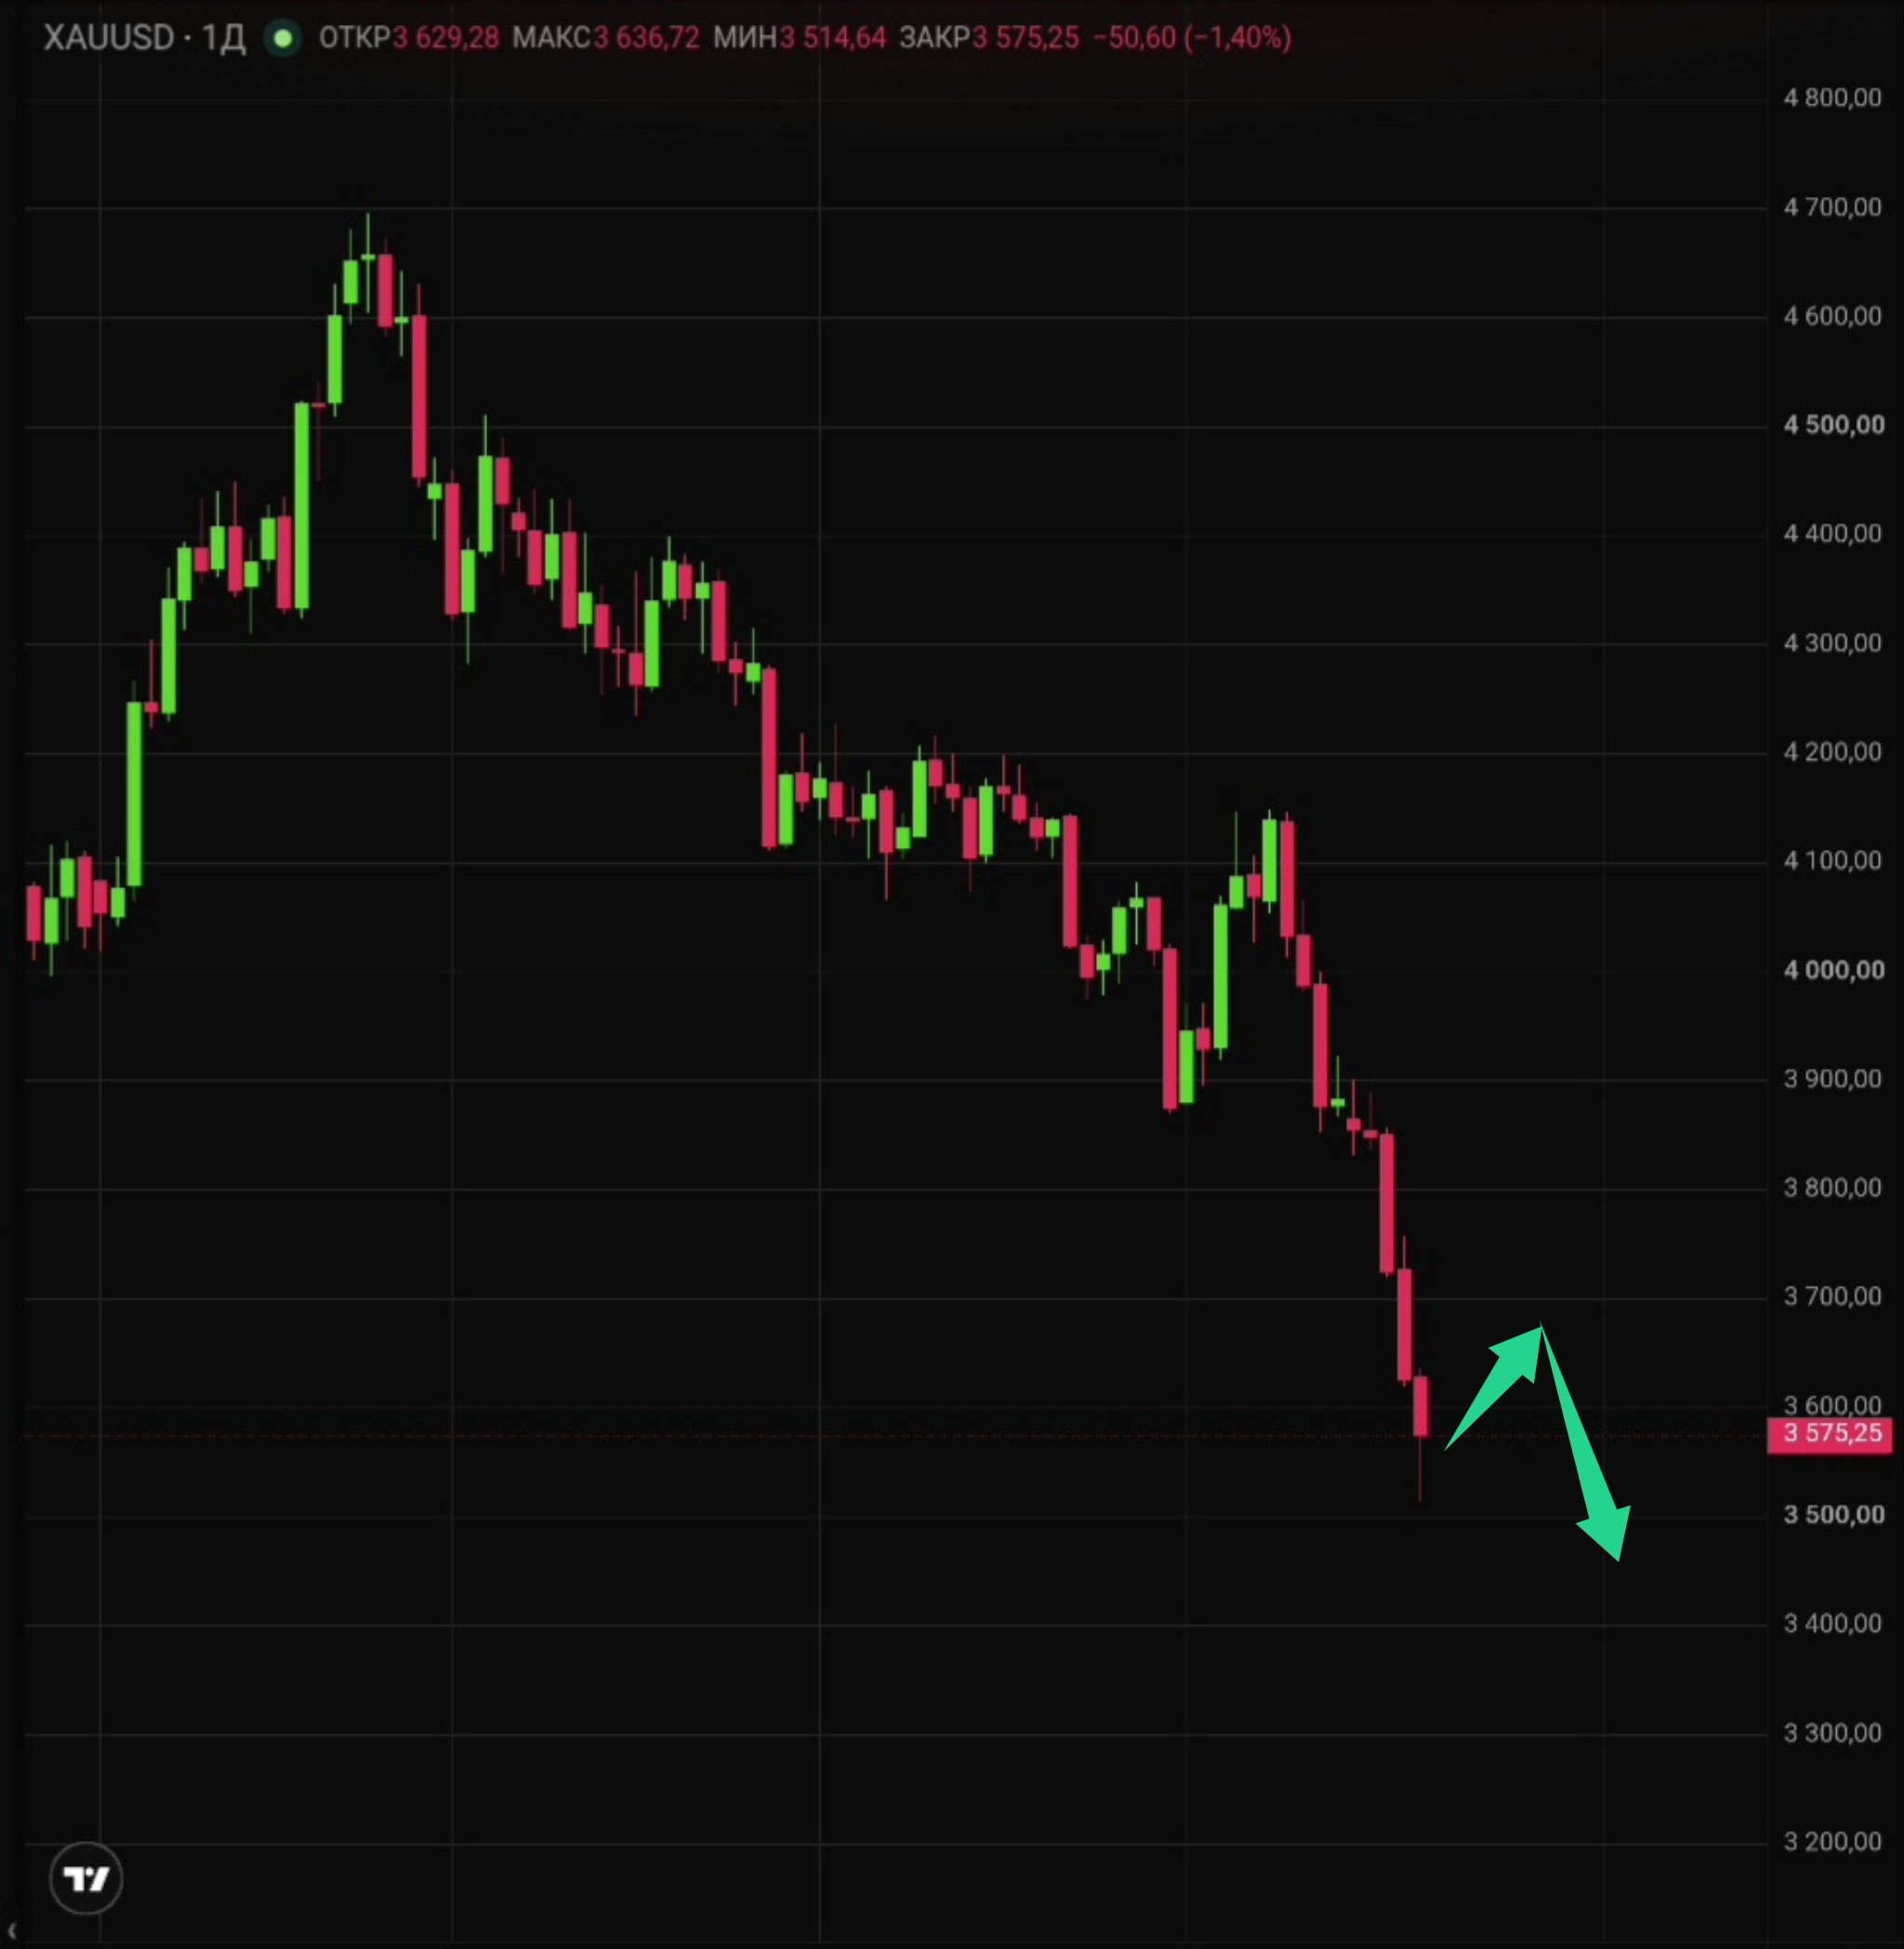
Spot gold is attempting to stabilize after a sharp decline, with bulls forming a demand zone near $3,550. The gold technical analysis on shorter timeframes suggests a potential local reversal, though the broader daily structure still lacks clear signs of a sustained turn higher. The technical outlook remains cautious until price can reclaim higher levels.
H1: Buyers have built a demand zone around $3,550 that looks like a local bottom. A recovery of roughly $100 toward $3,650 is possible if this area holds.
RSI: 38,93
MACD: Bullish
MA: 3,560
H4: The maximum near-term target for buyers from current levels is the $3,680–3,700 region, where selling pressure is likely to reappear.
RSI: 23,50
MACD: Bullish
MA: 3,641
Key gold support and resistance levels:
- Support: $3,550, then $3,520
- Resistance: $3,650, $3,680–3,700
Gold (XAU/USD) Trading Plan for Today
- Base scenario: bounce from $3,550 toward $3,650, then a turn lower (stop below $3,520).
- Alternative scenario: stronger recovery into $3,680–3,700 before sellers regain control.
Gold (XAU/USD) Live Price Today
Spot gold fell about 1.3% to a 14-month low as the dollar index climbed to its strongest levels since April 2025. Markets have almost fully priced in a 25 basis-point Fed rate hike in December, with the probability estimated near 94%. Rising rate expectations make gold less attractive relative to yield-bearing dollar assets.
Additional pressure came from equity market selling and potential margin-related liquidations. The key driver is not simply dollar strength but the concrete shift in expectations: a December hike is now the base case, which caps gold’s recovery potential.
On 20 November, attention turns to the Michigan Consumer Sentiment index (forecast 51.0) and the associated 1-year (4.3%) and 5-year (3.4%) inflation expectations, along with comments from Fed Governor Christopher Waller.
Higher inflation expectations would reinforce the case for tighter policy and support the dollar, while any easing in expectations could ease pressure on gold if yields also soften.
For now, the fundamental bias stays bearish while the hike probability remains elevated. A genuine recovery requires a signal that forces markets to reassess the December Fed outlook, not merely technical oversold conditions.

On the daily timeframe, there are still no clear signs of a reversal, so corrective signals on lower timeframes should be treated with caution.
Gold (XAU/USD) Price Forecast for Tomorrow
Tomorrow is Friday and markets will close for the weekend, so price action is expected to remain range-bound. The working range is $3,540–3,620. Any directional move will be deferred until Monday’s open.
Will gold go up tomorrow? No — formal quotes will not be supplied over the weekend.
| Date | November 20, 2026 |
| Minimum | $3,515 |
| Average |
$3,555 |
| Maximum |
$3,595 |
Gold (XAU/USD) Price Forecast for This Week
The gold weekly outlook remains dominated by the reassessment of Fed rate expectations.
The key event on 20 November is the University of Michigan Consumer Sentiment index and U.S. inflation expectations (15:00 UTC). Strong U.S. data, firm rhetoric from Fed officials, and the upcoming FOMC minutes can continue to weigh on the metal.
Escalation in the Middle East could provide some support for safe-haven demand. Overall, the gold price this week is expected to stay under pressure while the market prices a December hike as the base case.
| Date range | November 16–November 20, 2026 |
| Minimum | $3,515 |
| Average |
$3,708 |
| Maximum |
$3,900 |
Gold (XAU/USD) Price Forecast for the Next 30 Days
The XAU/USD 30-day forecast centres on successive U.S. data that will shape December Fed expectations. There is no rate decision scheduled in November; the next FOMC meeting with projections is set for 8–9 December, so November’s CPI, PPI, PCE, employment data and minutes will shape expectations heading into that meeting.
Key events include:
| Date | Event | Potential impact |
| November 6 | Nonfarm Payrolls | High |
|
November, 10 |
U.S. CPI (October) | Medium |
| November 13 | U.S. PPI (October) | Medium |
| November 17 | U.S. Industrial Production | High |
| November 18 | FOMC Minutes | High |
30-Day Scenarios
- Base case: consolidation in the $3,700–$3,900 zone.
- Bullish scenario: recovery above $4,000 if Fed pricing softens materially.
- Bearish scenario: a break below $3,700 targeting $3,500.
Geopolitical risk remains an additional variable, yet the recent sell-off demonstrated that gold can fall alongside equities when liquidity is scarce.
Gold Price Analysis and Forecasting Methodology
Our gold forecast methodology combines technical analysis, fundamental analysis, and market sentiment. Technical analysis evaluates price action, trends, support and resistance, RSI, MACD, and other indicators across multiple timeframes. Fundamental analysis considers interest rates, inflation, the US dollar, Treasury yields, and major economic events. Sentiment analysis helps identify changes in investor positioning and risk appetite. The final forecast represents a scenario-based assessment of potential market movements and is not a guarantee of future prices.
Is Gold a Good Investment?
Is gold a good investment? Gold can play an important role in a diversified portfolio because it may provide diversification and help hedge against certain market and economic risks. Investors should consider their investment horizon, risk tolerance, and current market conditions before making an investment decision.
You can start trading gold and other financial instruments with Investizo.
Summary
Gold has formed a potential demand zone near $3,550 after a sharp decline driven by rising Fed hike expectations. The near-term technical picture allows for a rebound toward $3,650–3,700, but the broader daily structure remains bearish until a clear signal forces markets to reassess the December rate outlook. Until then, corrective rallies are likely to face selling pressure.
The trade levels, signals and forecasts in this article are calculated automatically from technical indicators and price history. They are not investment advice or a recommendation to buy or sell any financial instrument. Past performance and forecasts do not guarantee future results. Risk Warning: CFDs are complex financial products traded on margin. Trading CFDs is risky and may not be suitable for all investors. Ensure you understand the risks involved as you may lose all your invested capital.
Gold (XAU/USD) Price Forecast FAQs
What is the current price of XAU/USD now?
November 21, 2026
$
Will Gold Go Up Tomorrow?
No. Tomorrow is Friday and markets will close for the weekend, so formal quotes will not be supplied until Monday’s open. Any move will have to wait for the next trading session.
Will Gold Rise or Fall Next Week?
The bias remains mildly lower while price stays below $3,680–3,700. A rebound from the $3,550 demand zone toward $3,650 is possible, but renewed selling pressure is the base case unless Fed hike expectations soften.
What Could Trigger a Short-Term Drop in Gold (XAU/USD)?
A clear rejection from $3,650–3,700, stronger-than-expected U.S. data, or firm Fed rhetoric reinforcing December hike odds would likely push gold back toward $3,550 or lower. A break of the $3,550 demand zone would accelerate the decline.
How Do We Do Gold Technical Analysis?
We analyze price action, trends, support and resistance levels, moving averages, RSI and MACD across H1, H4 and higher timeframes. Major events that can affect XAU/USD volatility are also considered.
How to Trade Gold Technical Analysis?
Technical analysis can help identify potential entry points, targets and stop-loss levels. A trading setup should be based on confirmation of the market scenario and predefined risk rather than a single indicator.
Nikolai Krishtopov is a Market Analyst at Investizo with more than 15 years of experience in the financial markets industry and over a decade of trading experience. His areas of focus include forex and crypto markets, technical analysis, intraday trading and market behaviour.
Award history
More about awards
2023—2026 - 10 awards achieved