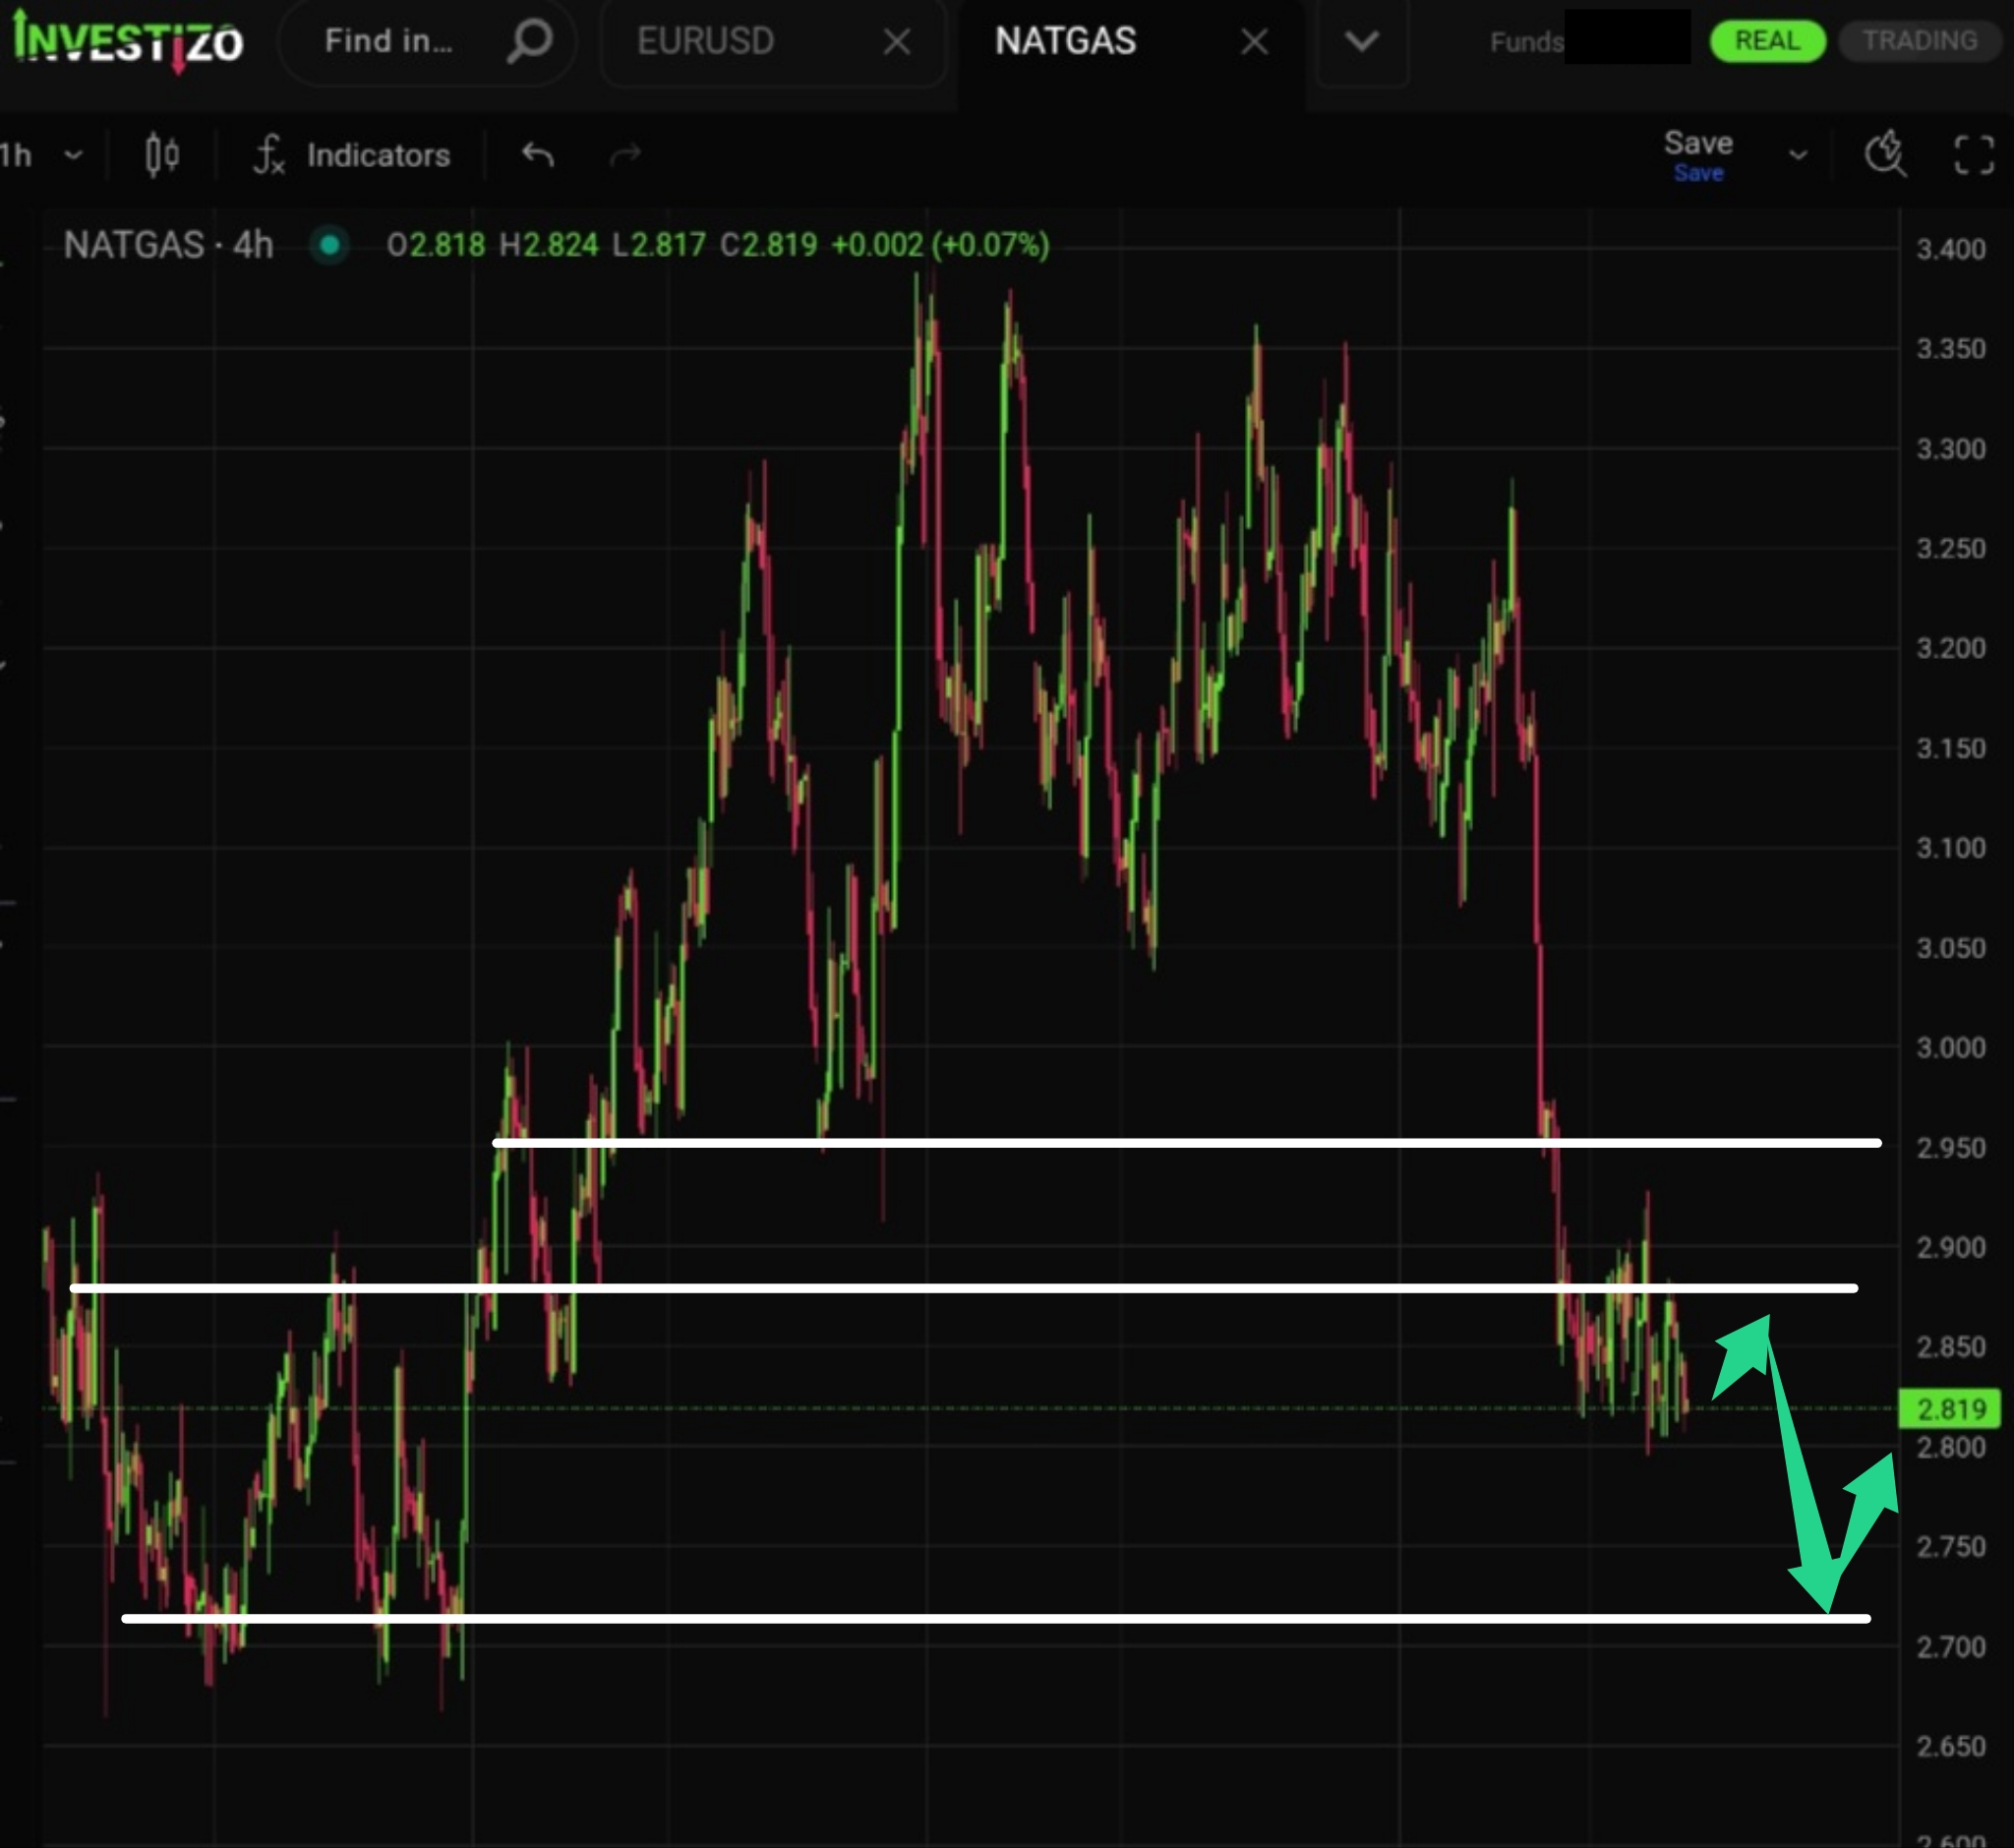
Natural Gas, Technical Analysis – H4
Local support for the price appears unstable. The market will likely need to test the demand zone at 2,700–2,720.
Investizo LTD. Business company number 25432 BC 2019
Suite 305, Griffith Corporate Centre,
P.O. Box 1510, Beachmont, Kingstown,
St. Vincent and the Grenadines
DUNS 817053497
Phone:+996312610515
E-mail: [email protected]
© 2019-2026 Investizo 18+ Hak cipta terpelihara
Amaran Risiko: CFD adalah produk kewangan kompleks yang diperdagangkan berdasarkan margin. Perdagangan CFD berisiko dan mungkin tidak sesuai untuk sebilangan pelabur. Pastikan anda memahami risiko yang dihadapi kerana anda mungkin kehilangan semua modal yang anda laburkan.
Local support for the price appears unstable. The market will likely need to test the demand zone at 2,700–2,720.
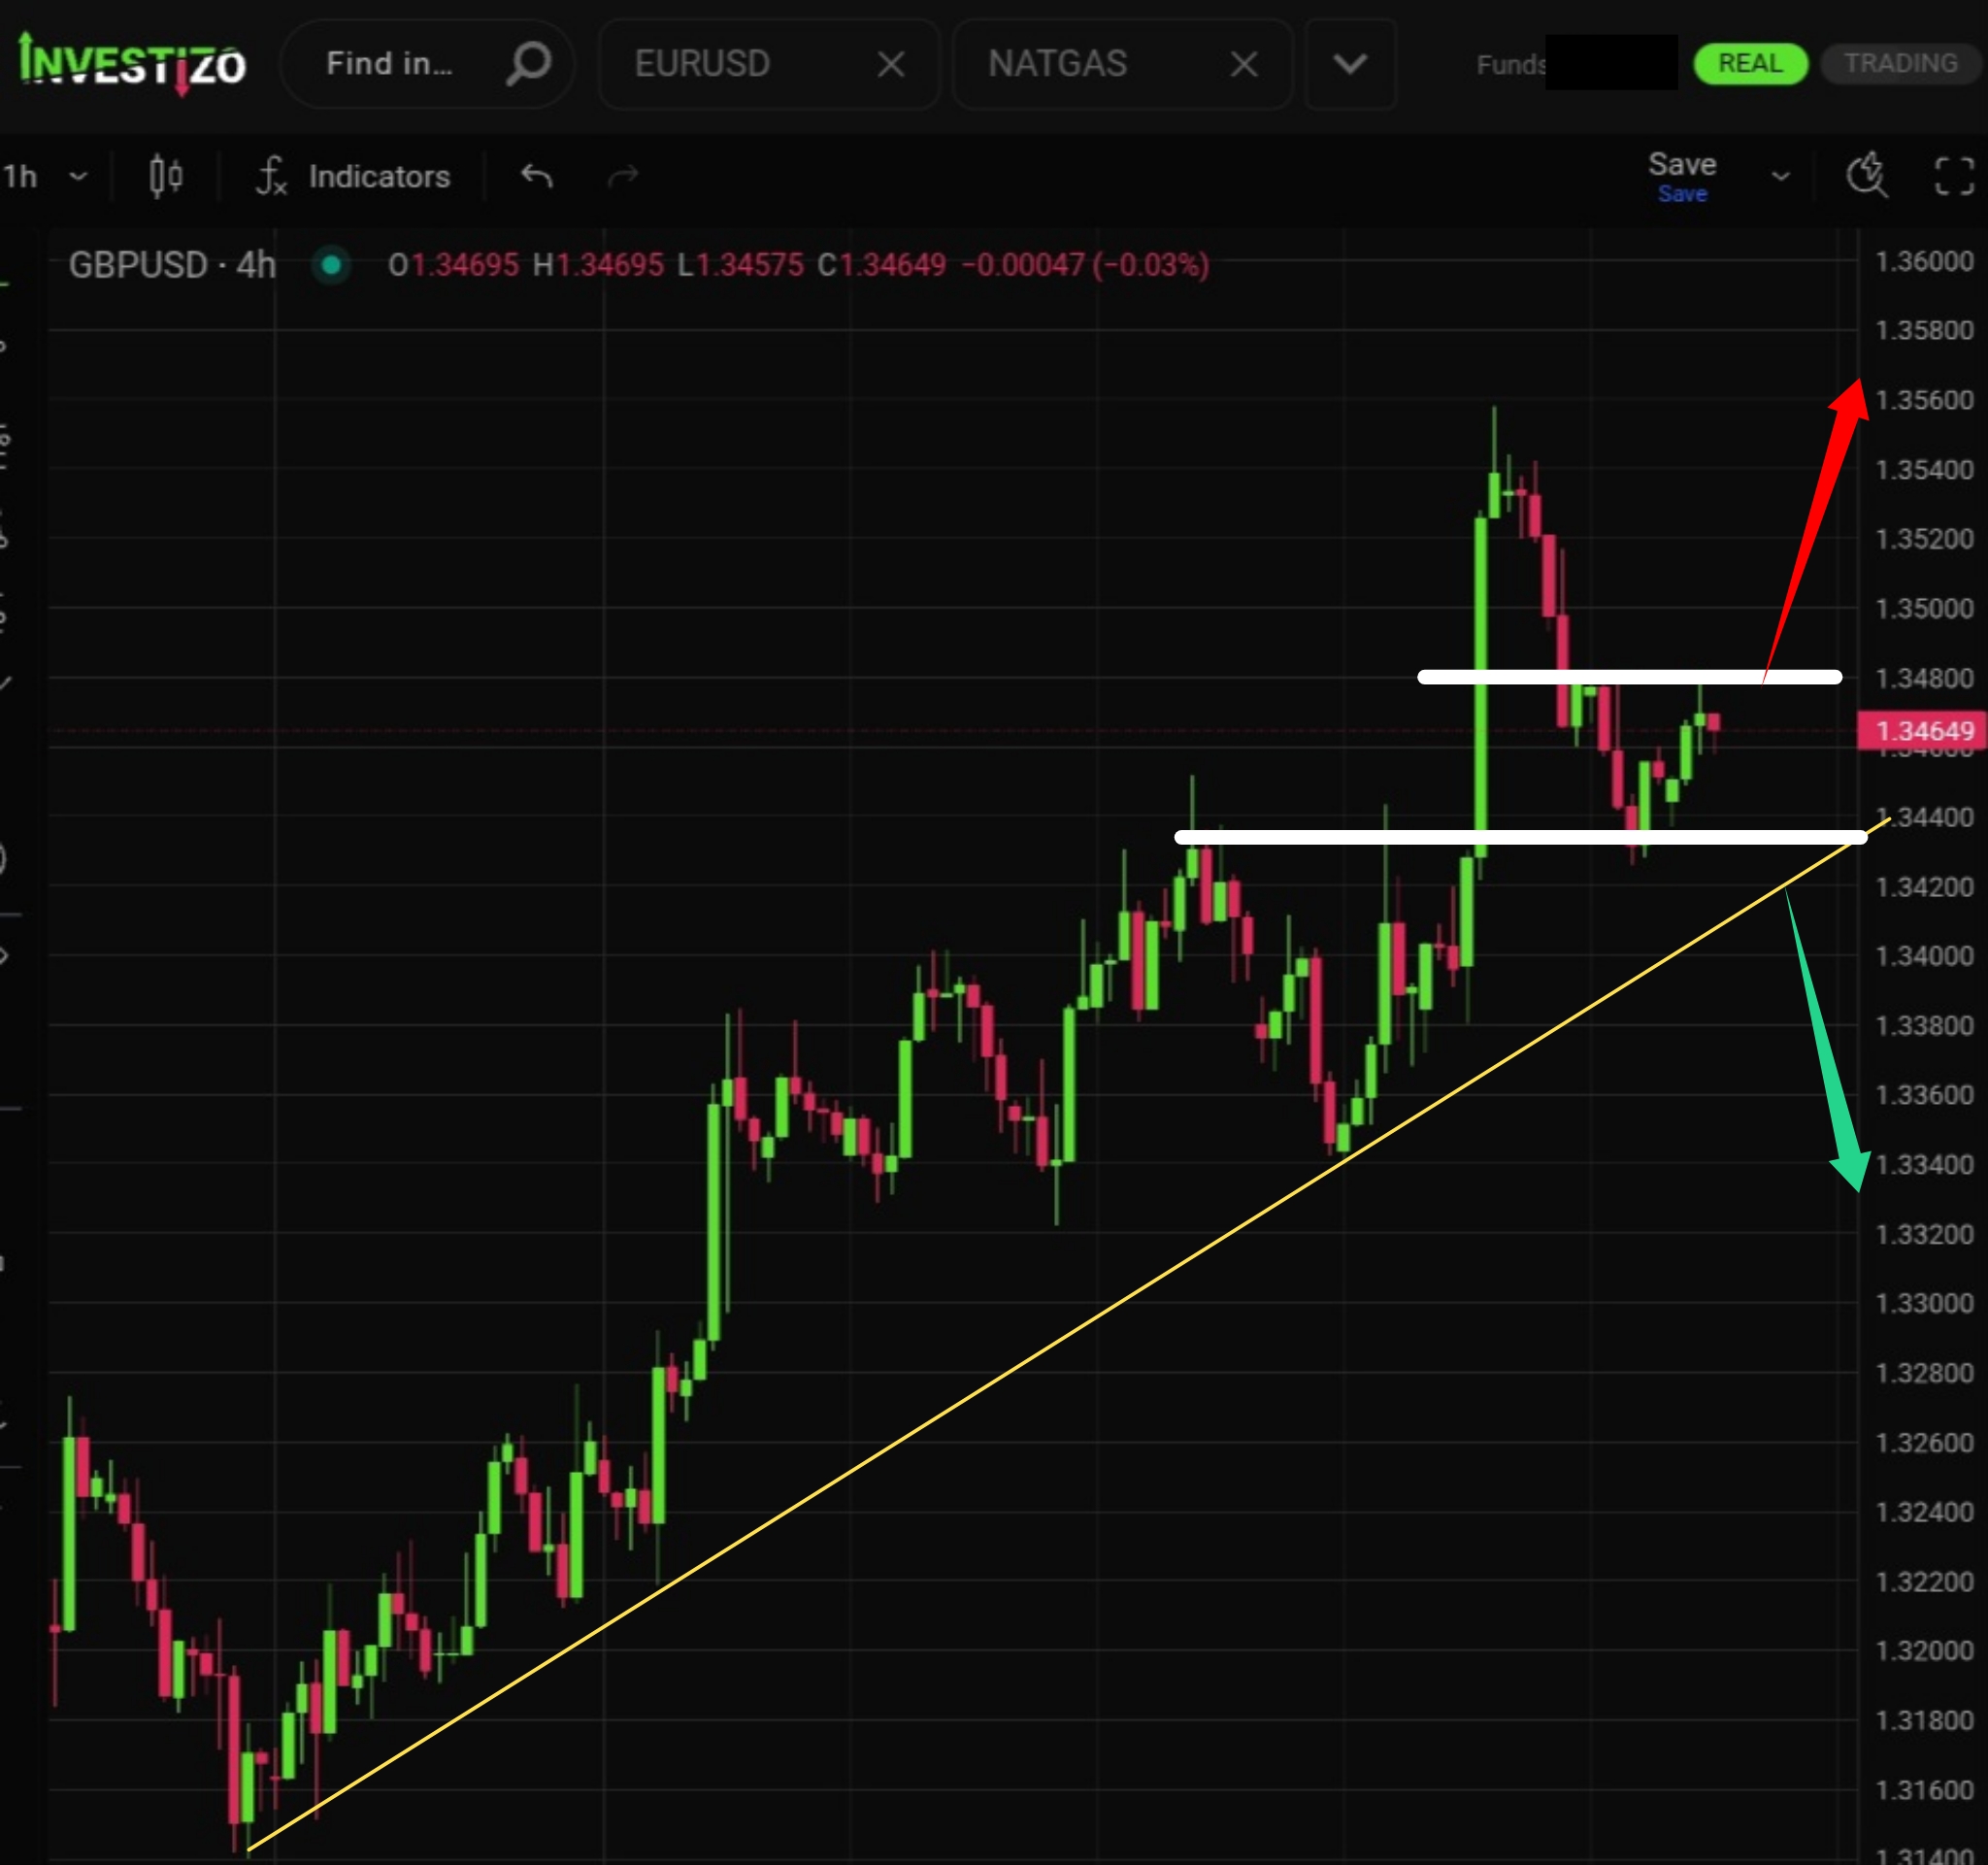
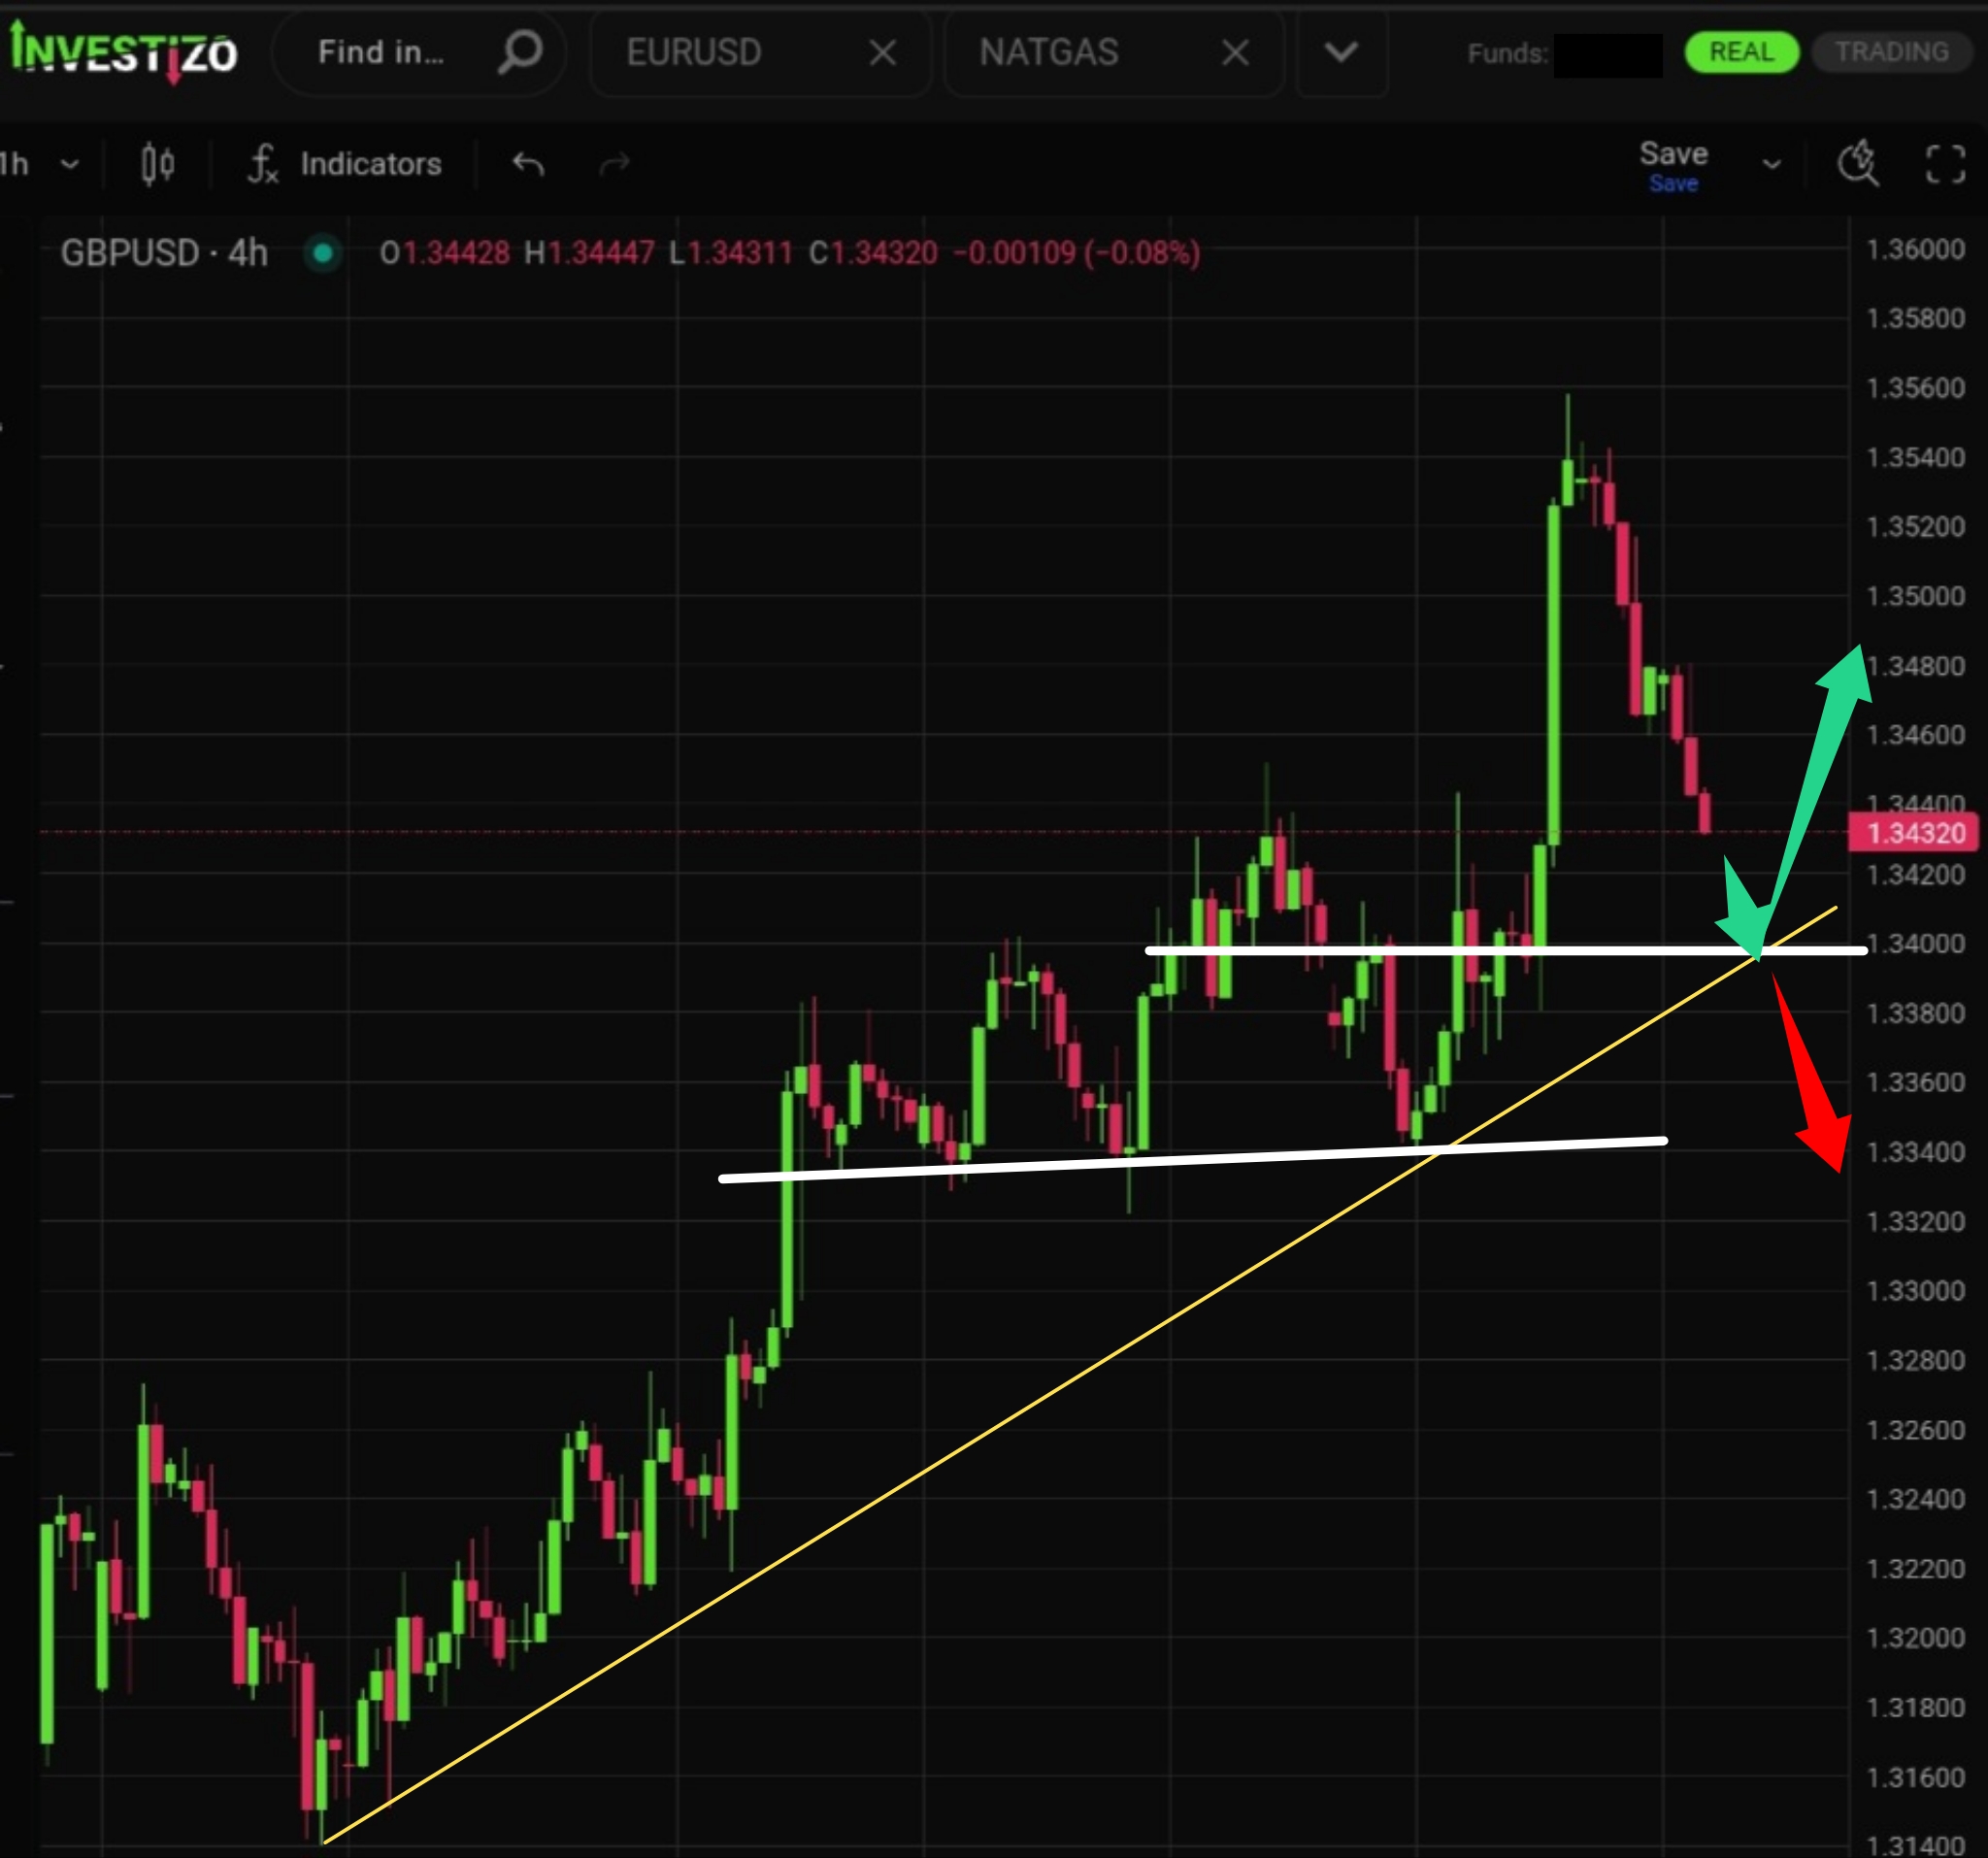
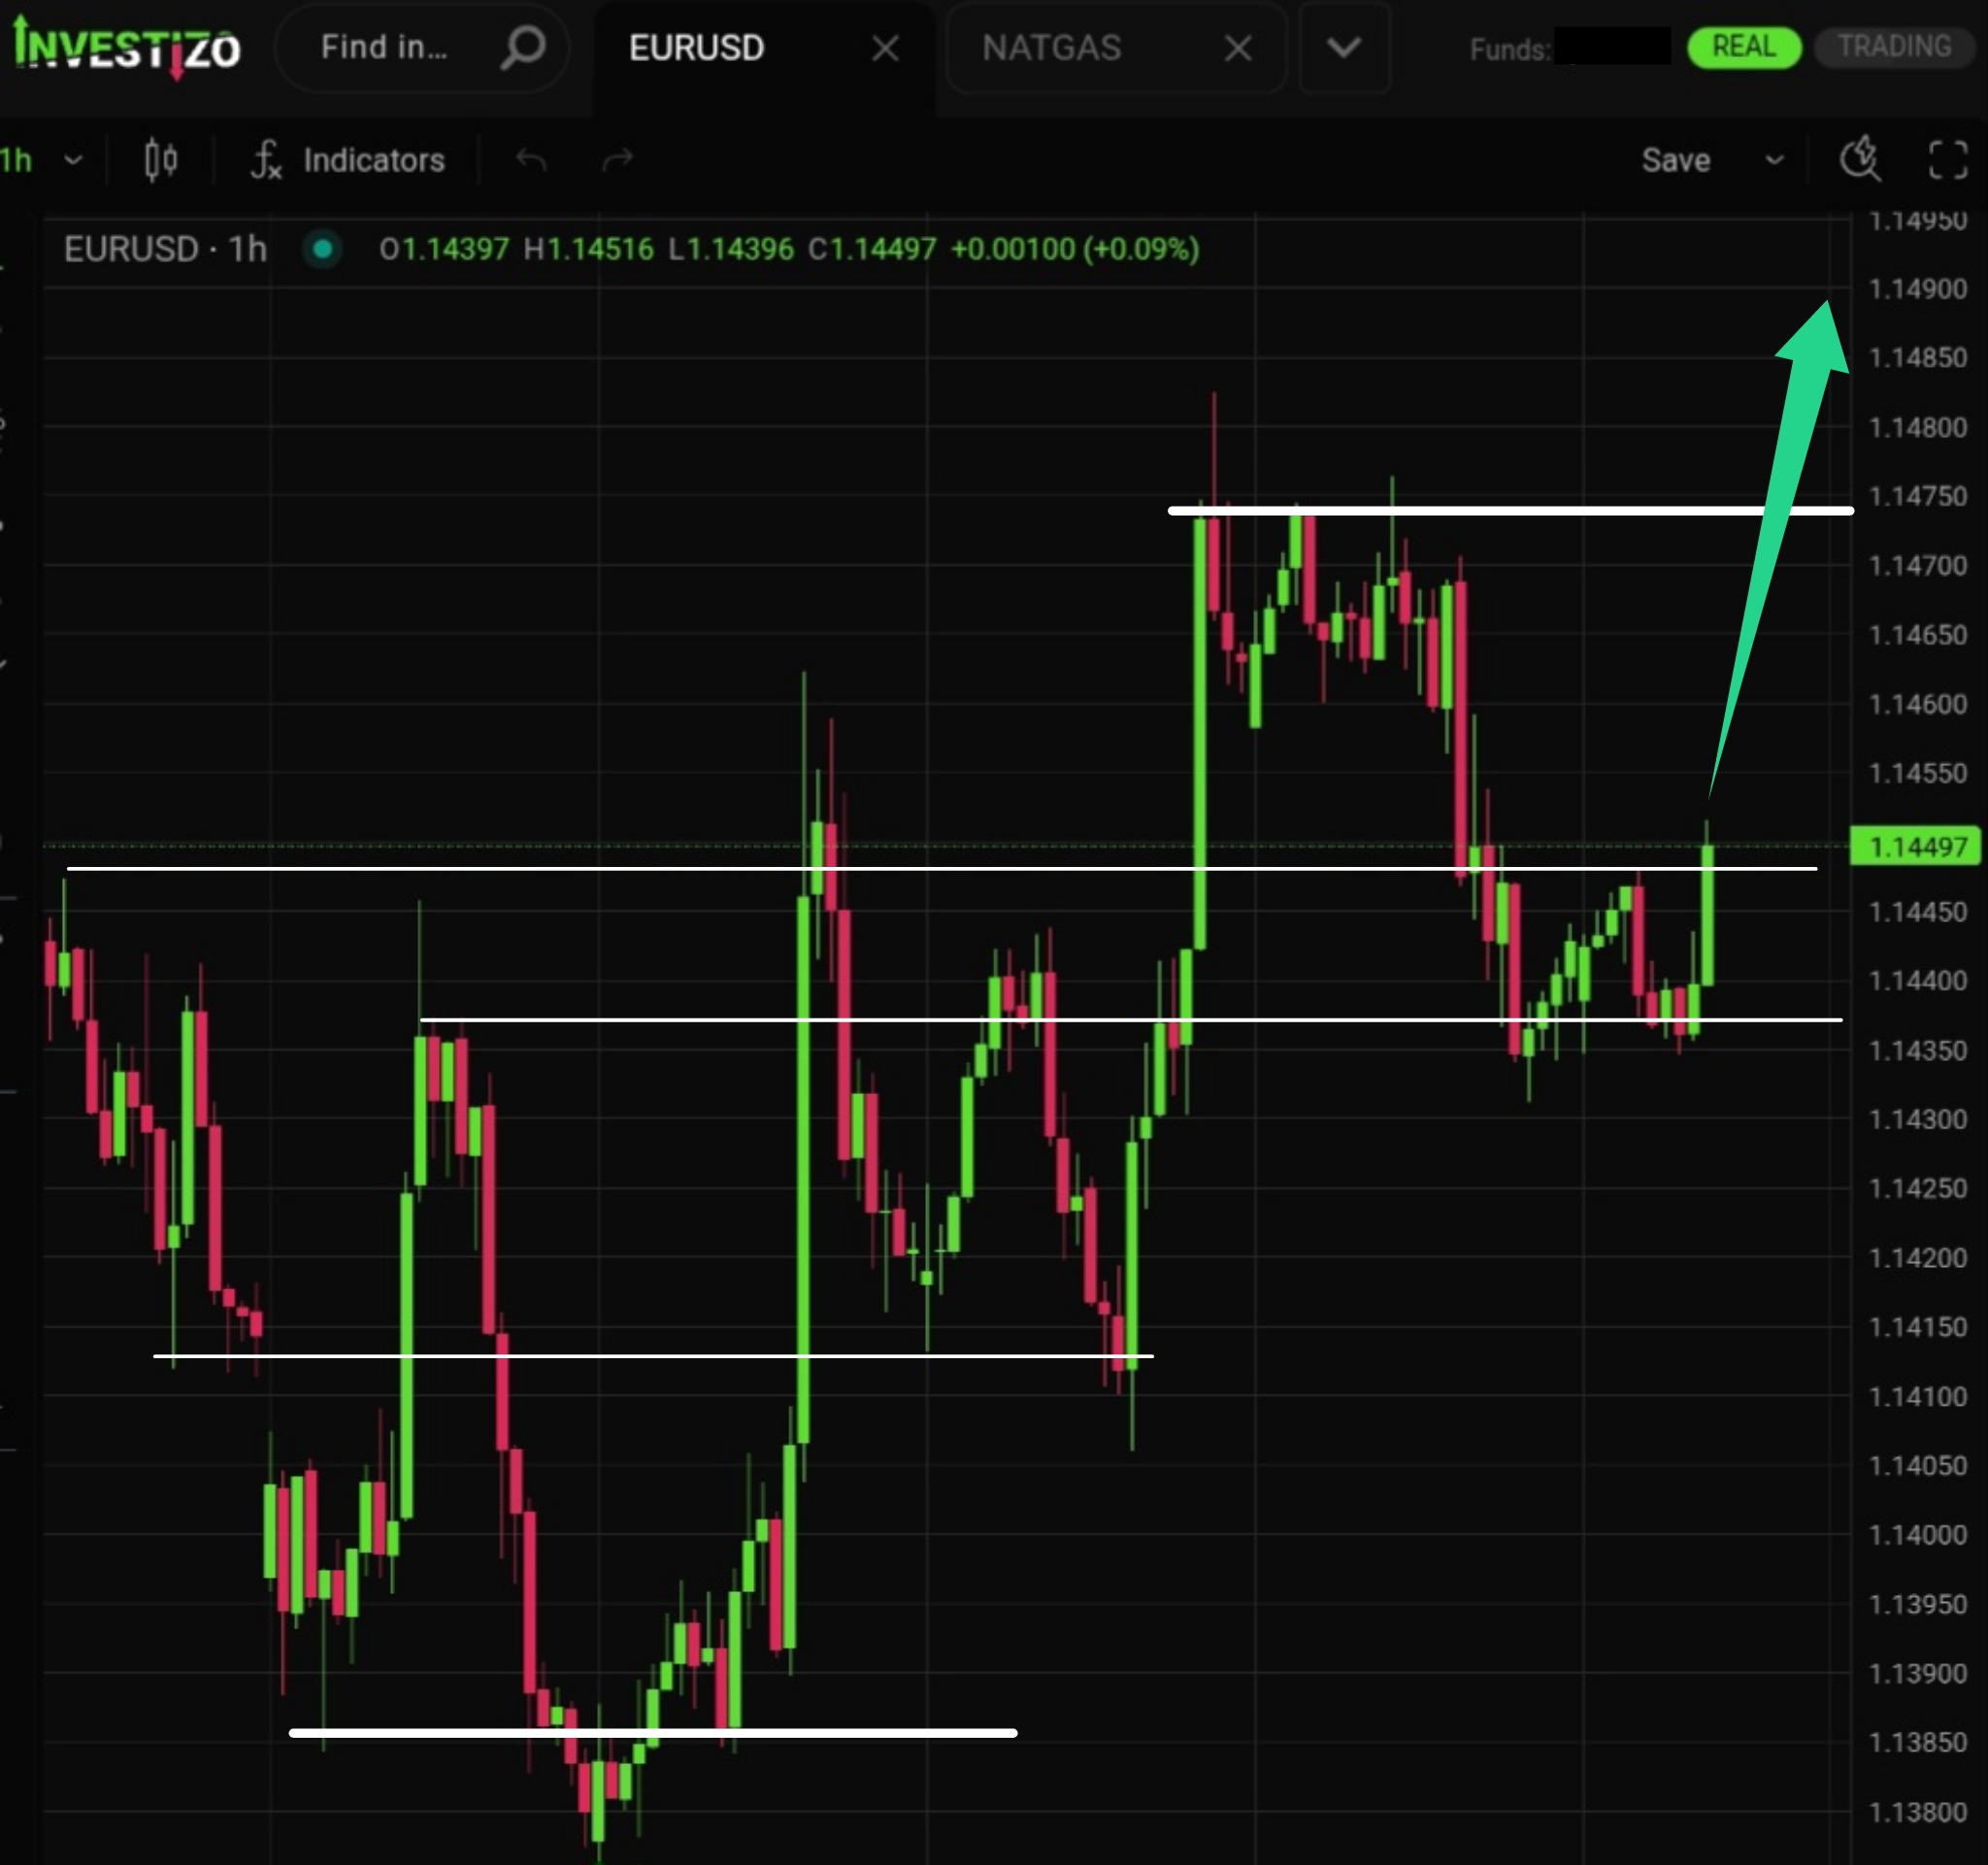
The pair technically maintains its uptrend for now (valid as long as the medium-term trendline around 1.3420 remains intact).
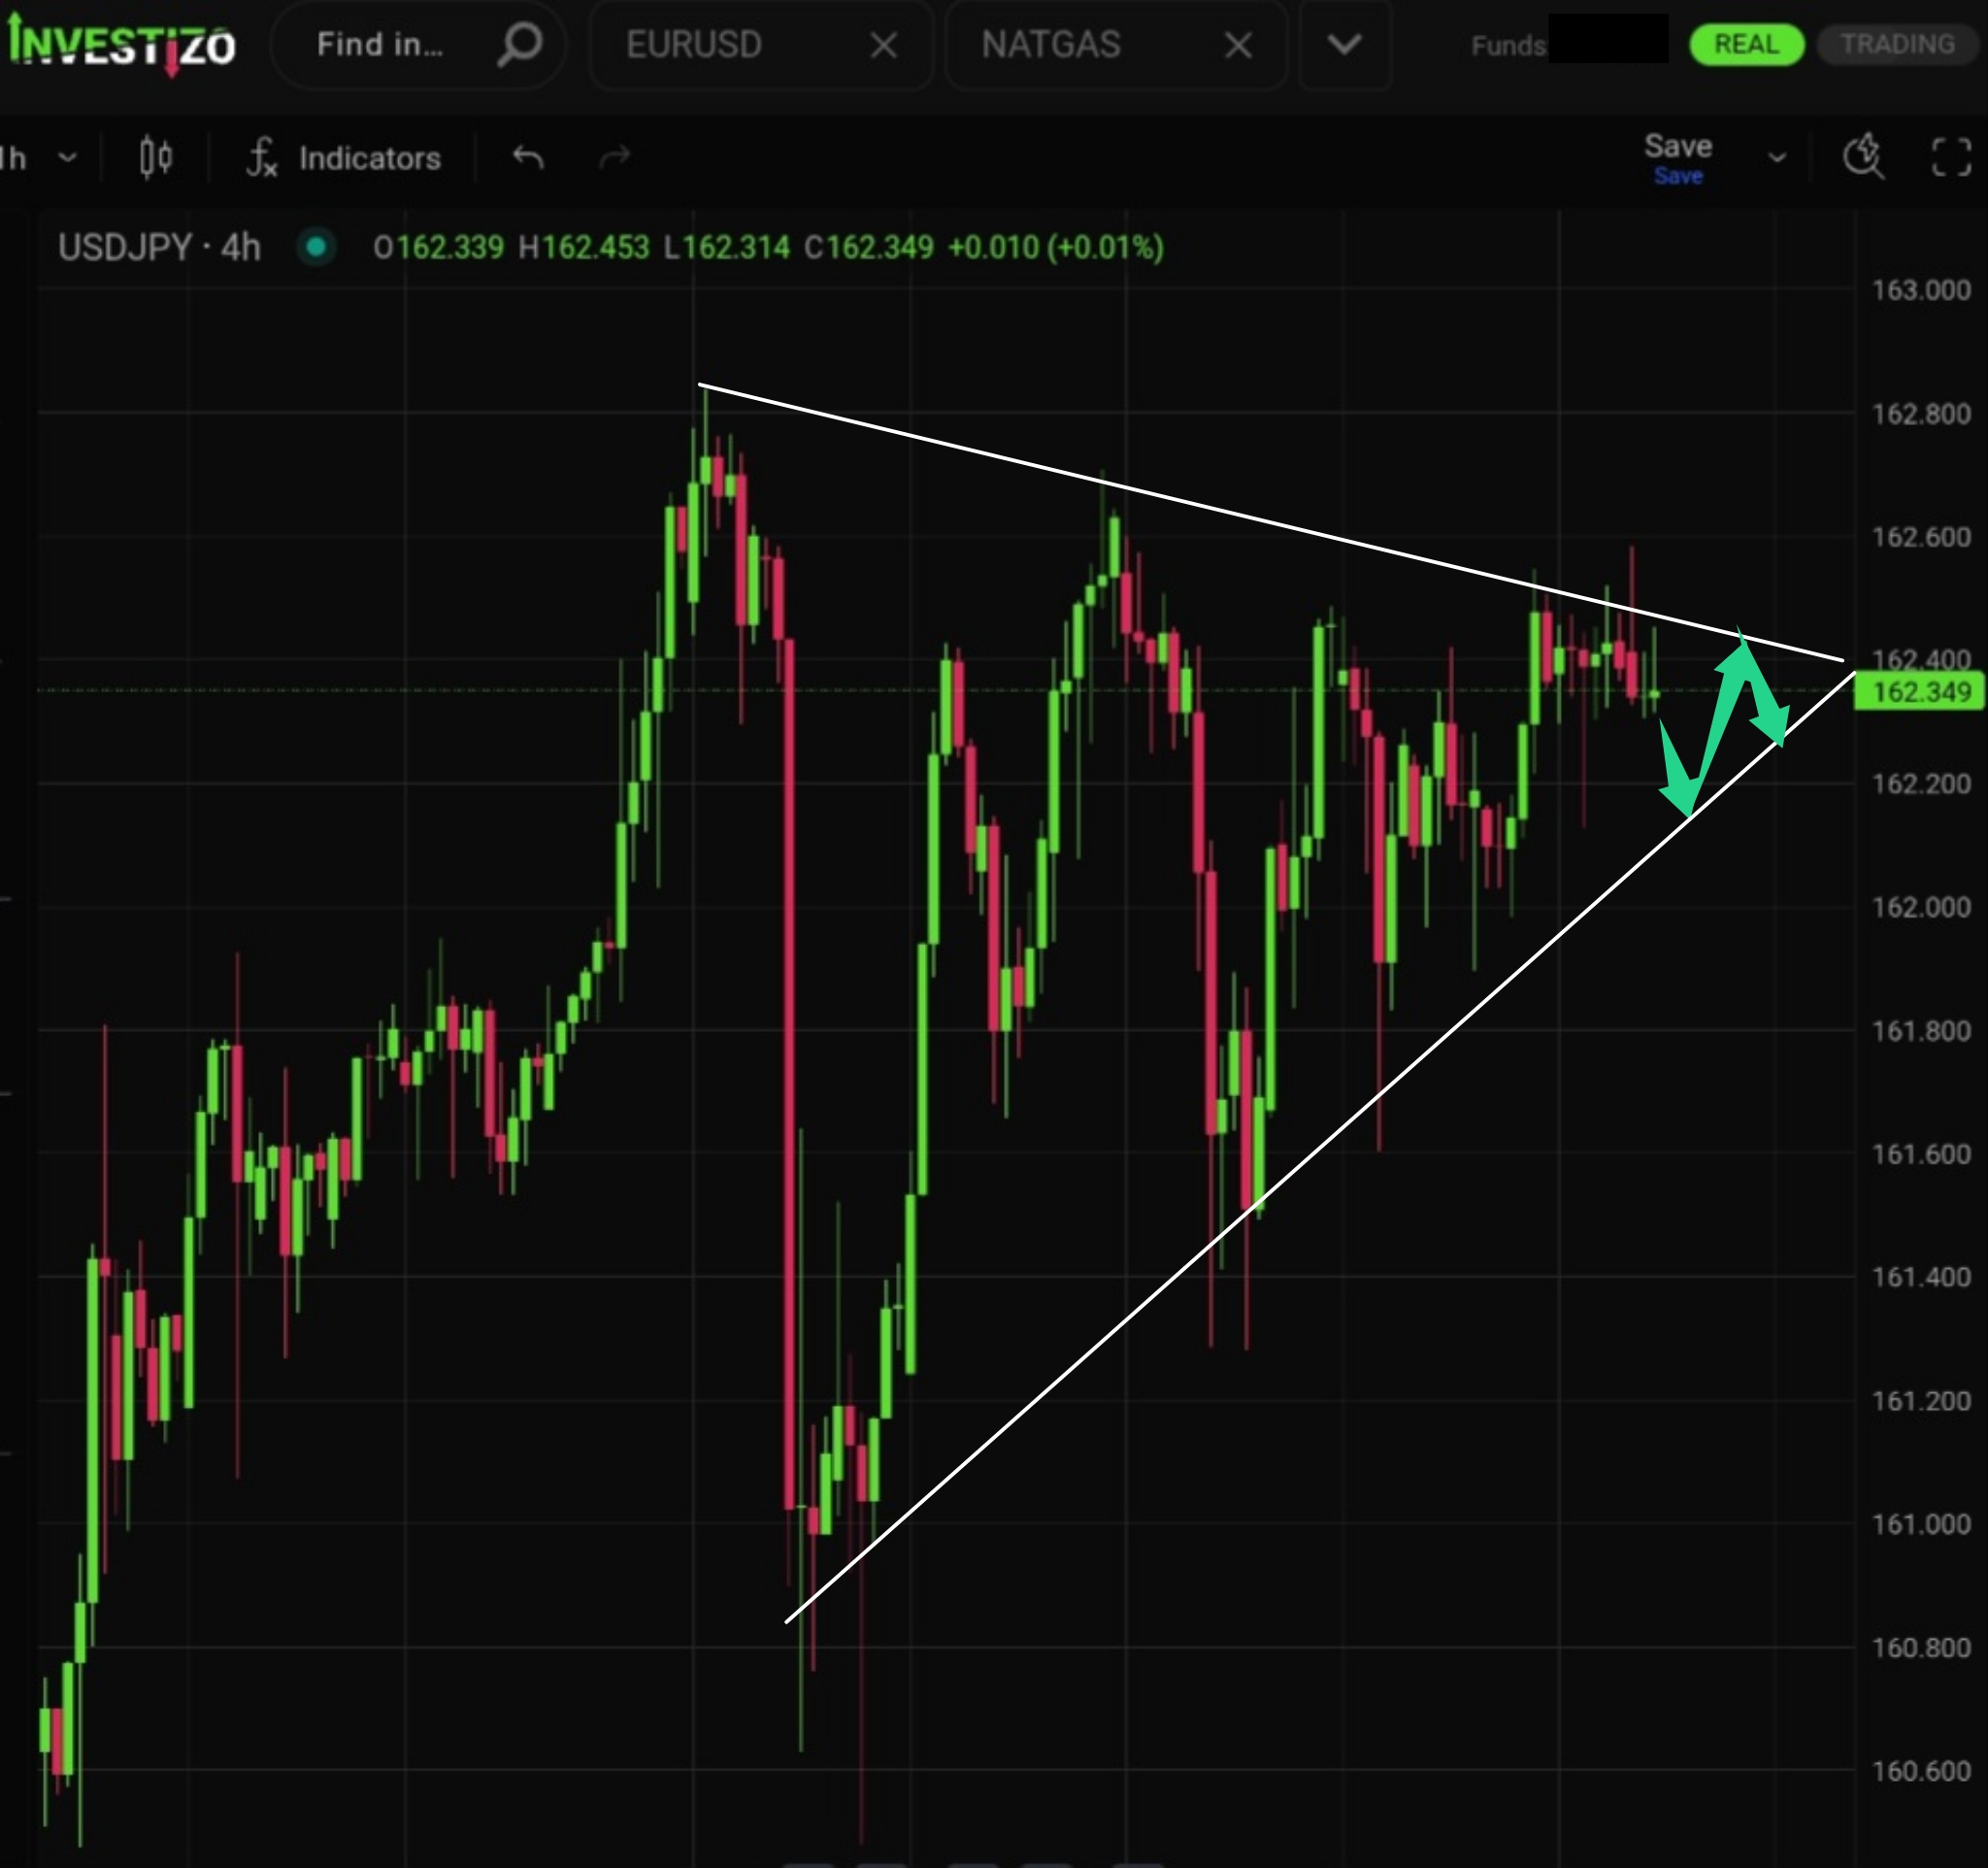
The pair’s trading range continues to tighten sharply. There is still enough room left for today’s session.
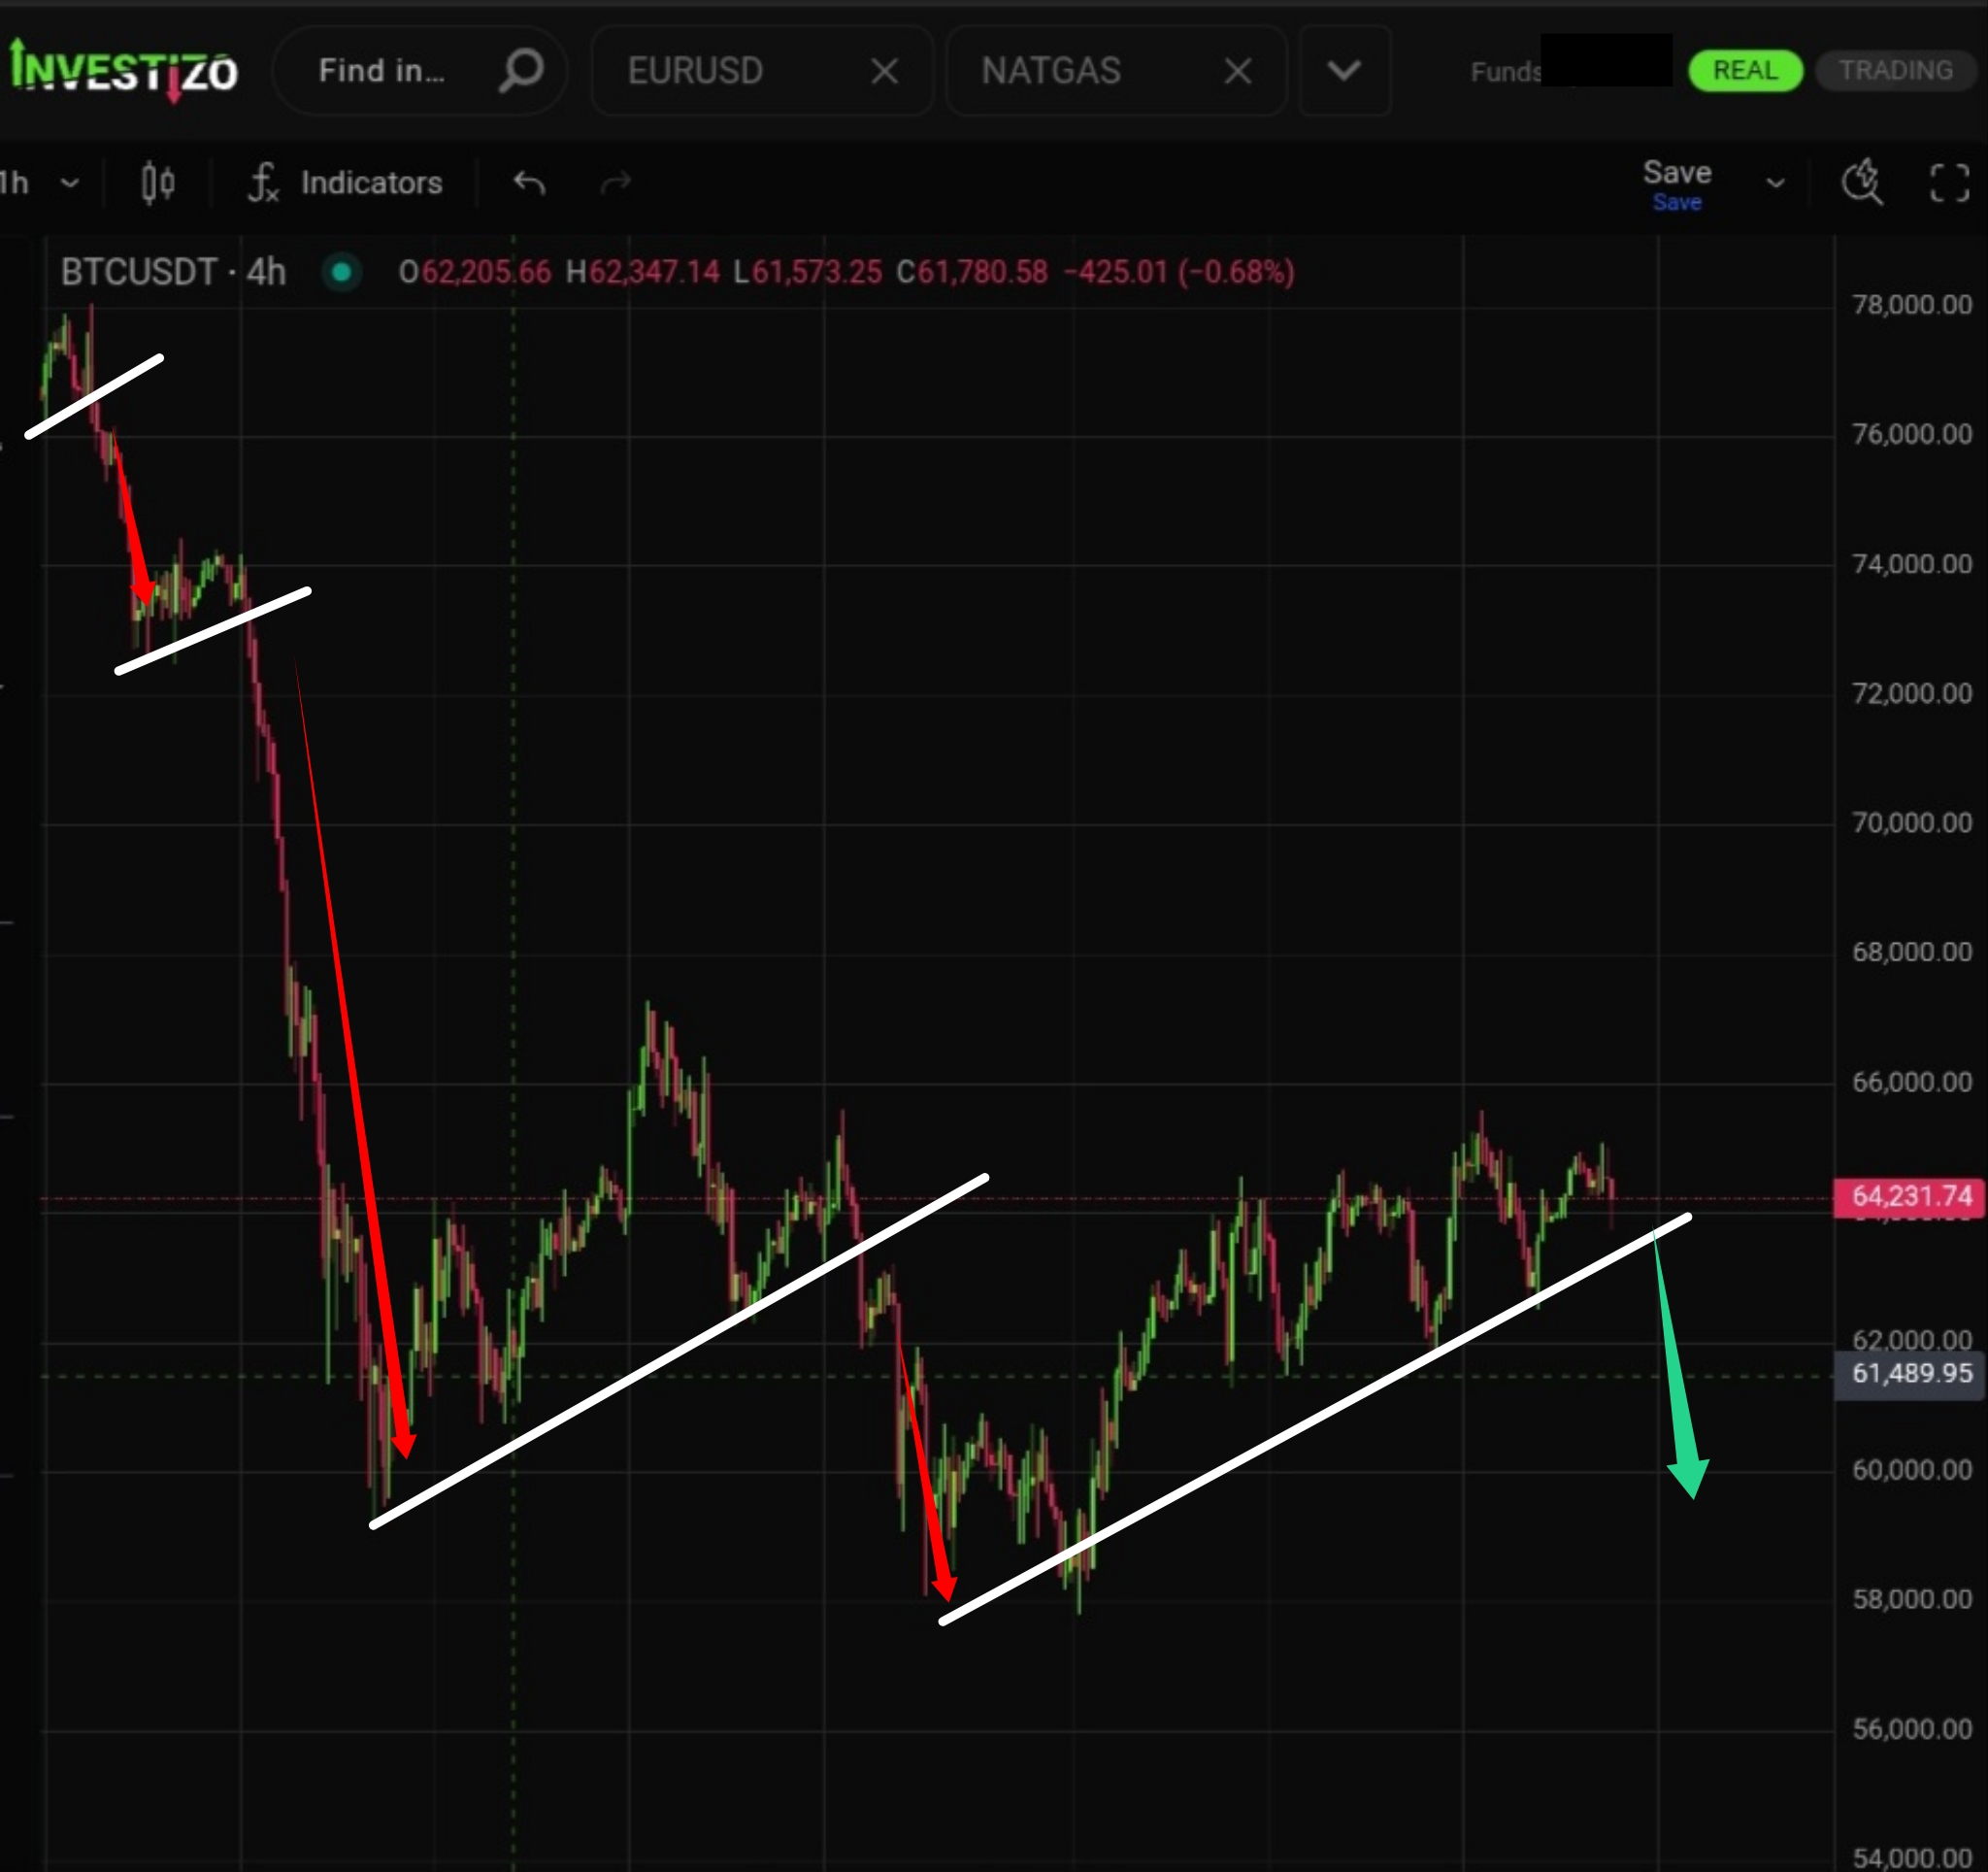
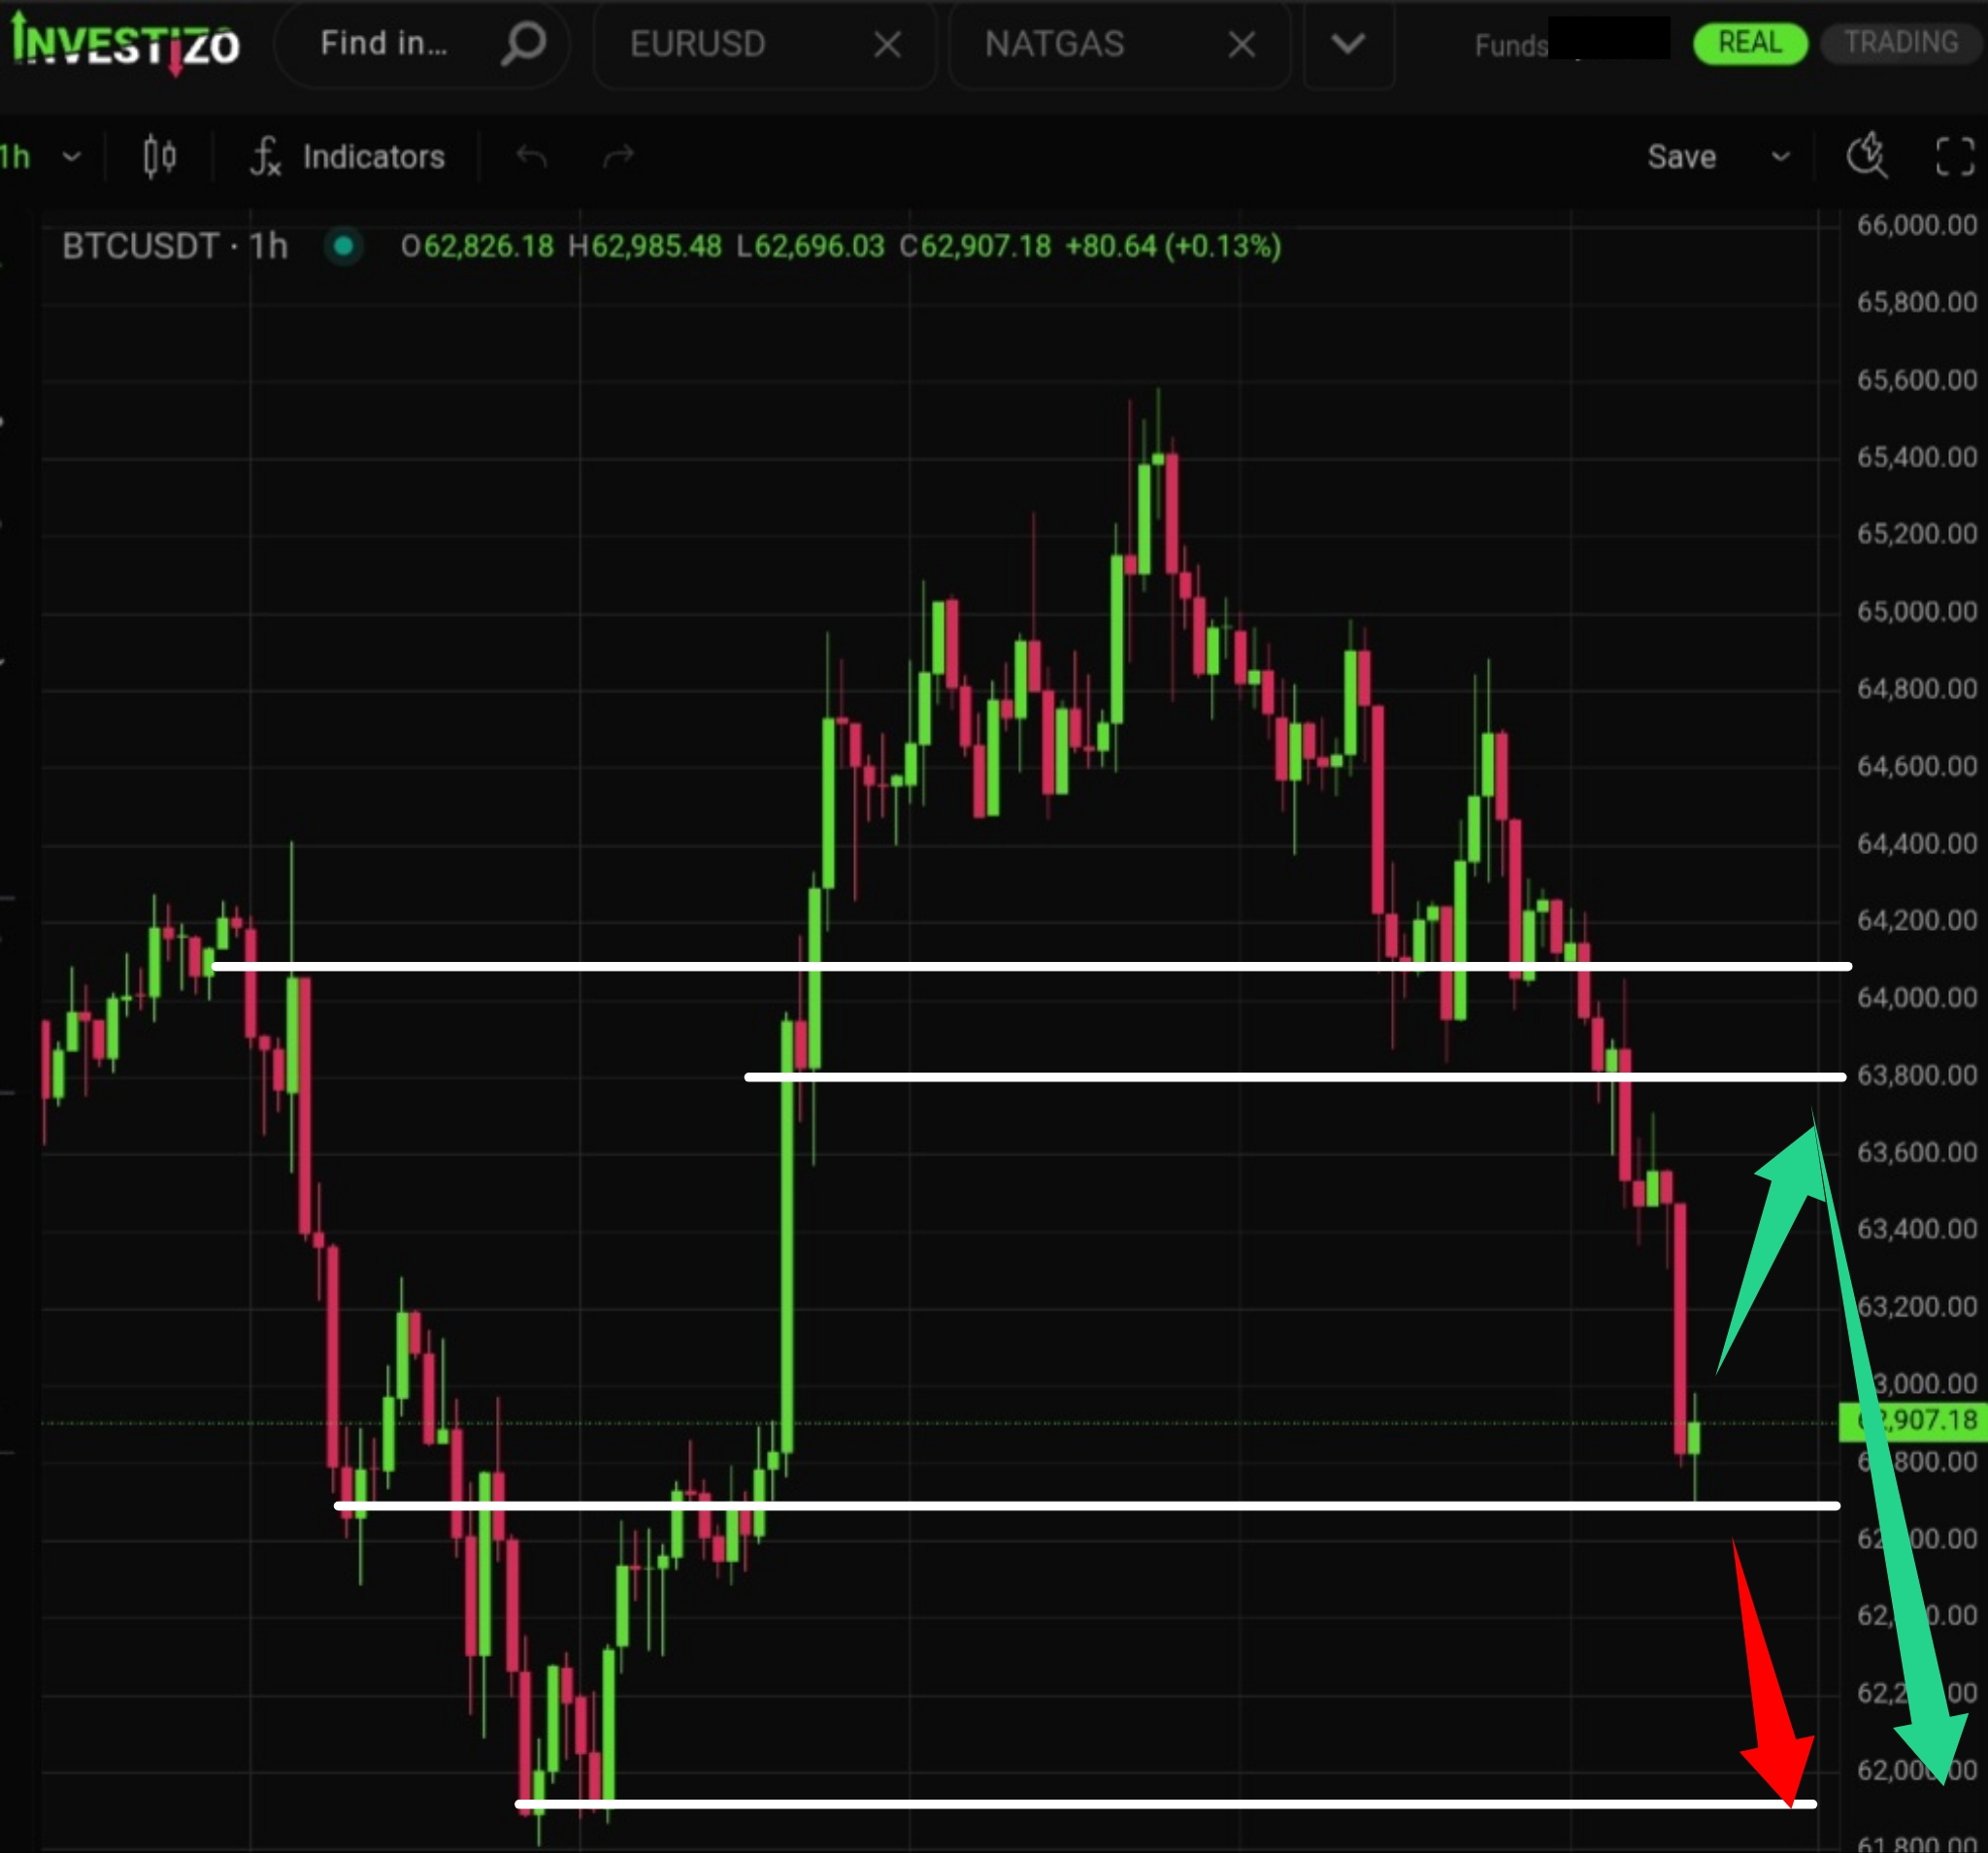
Bitcoin is currently in a consolidation phase ahead of a likely continuation of the medium-term downtrend.
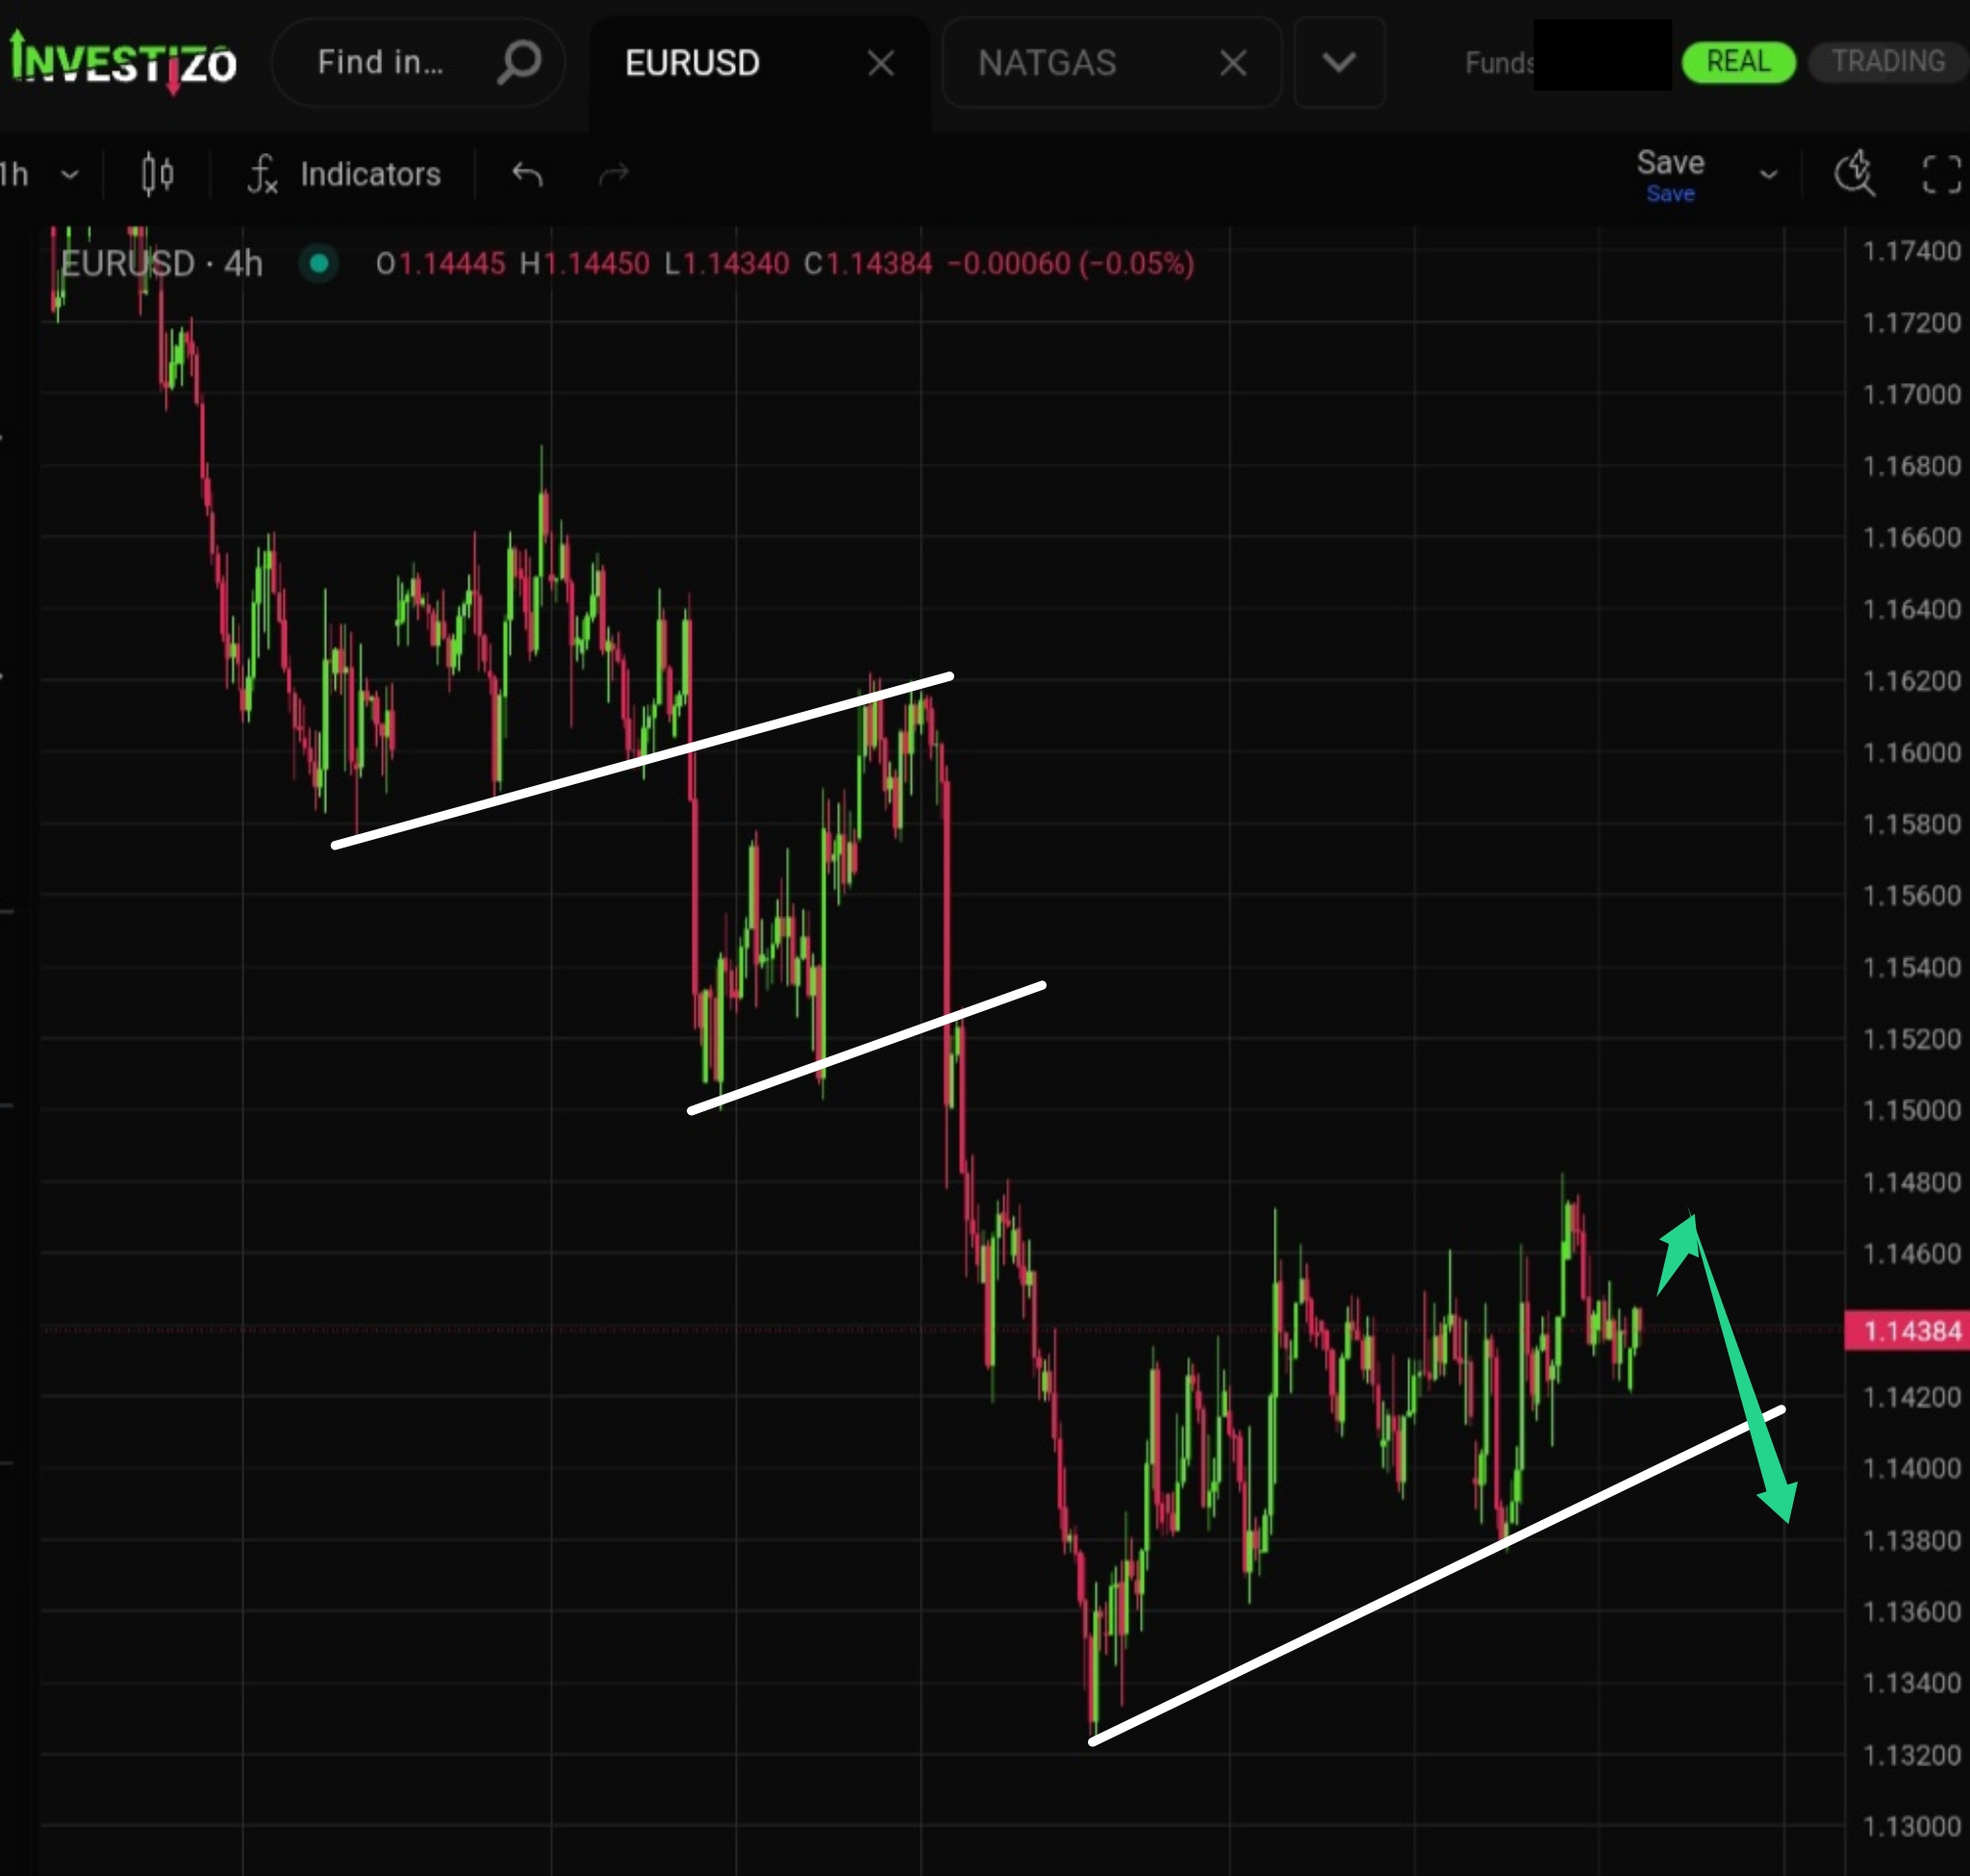
Despite some optimism for the euro seen last week, the pair remains under persistent downside pressure.
Gold trades at 4,005 this Monday morning, extending its sharpest weekly decline in six weeks.
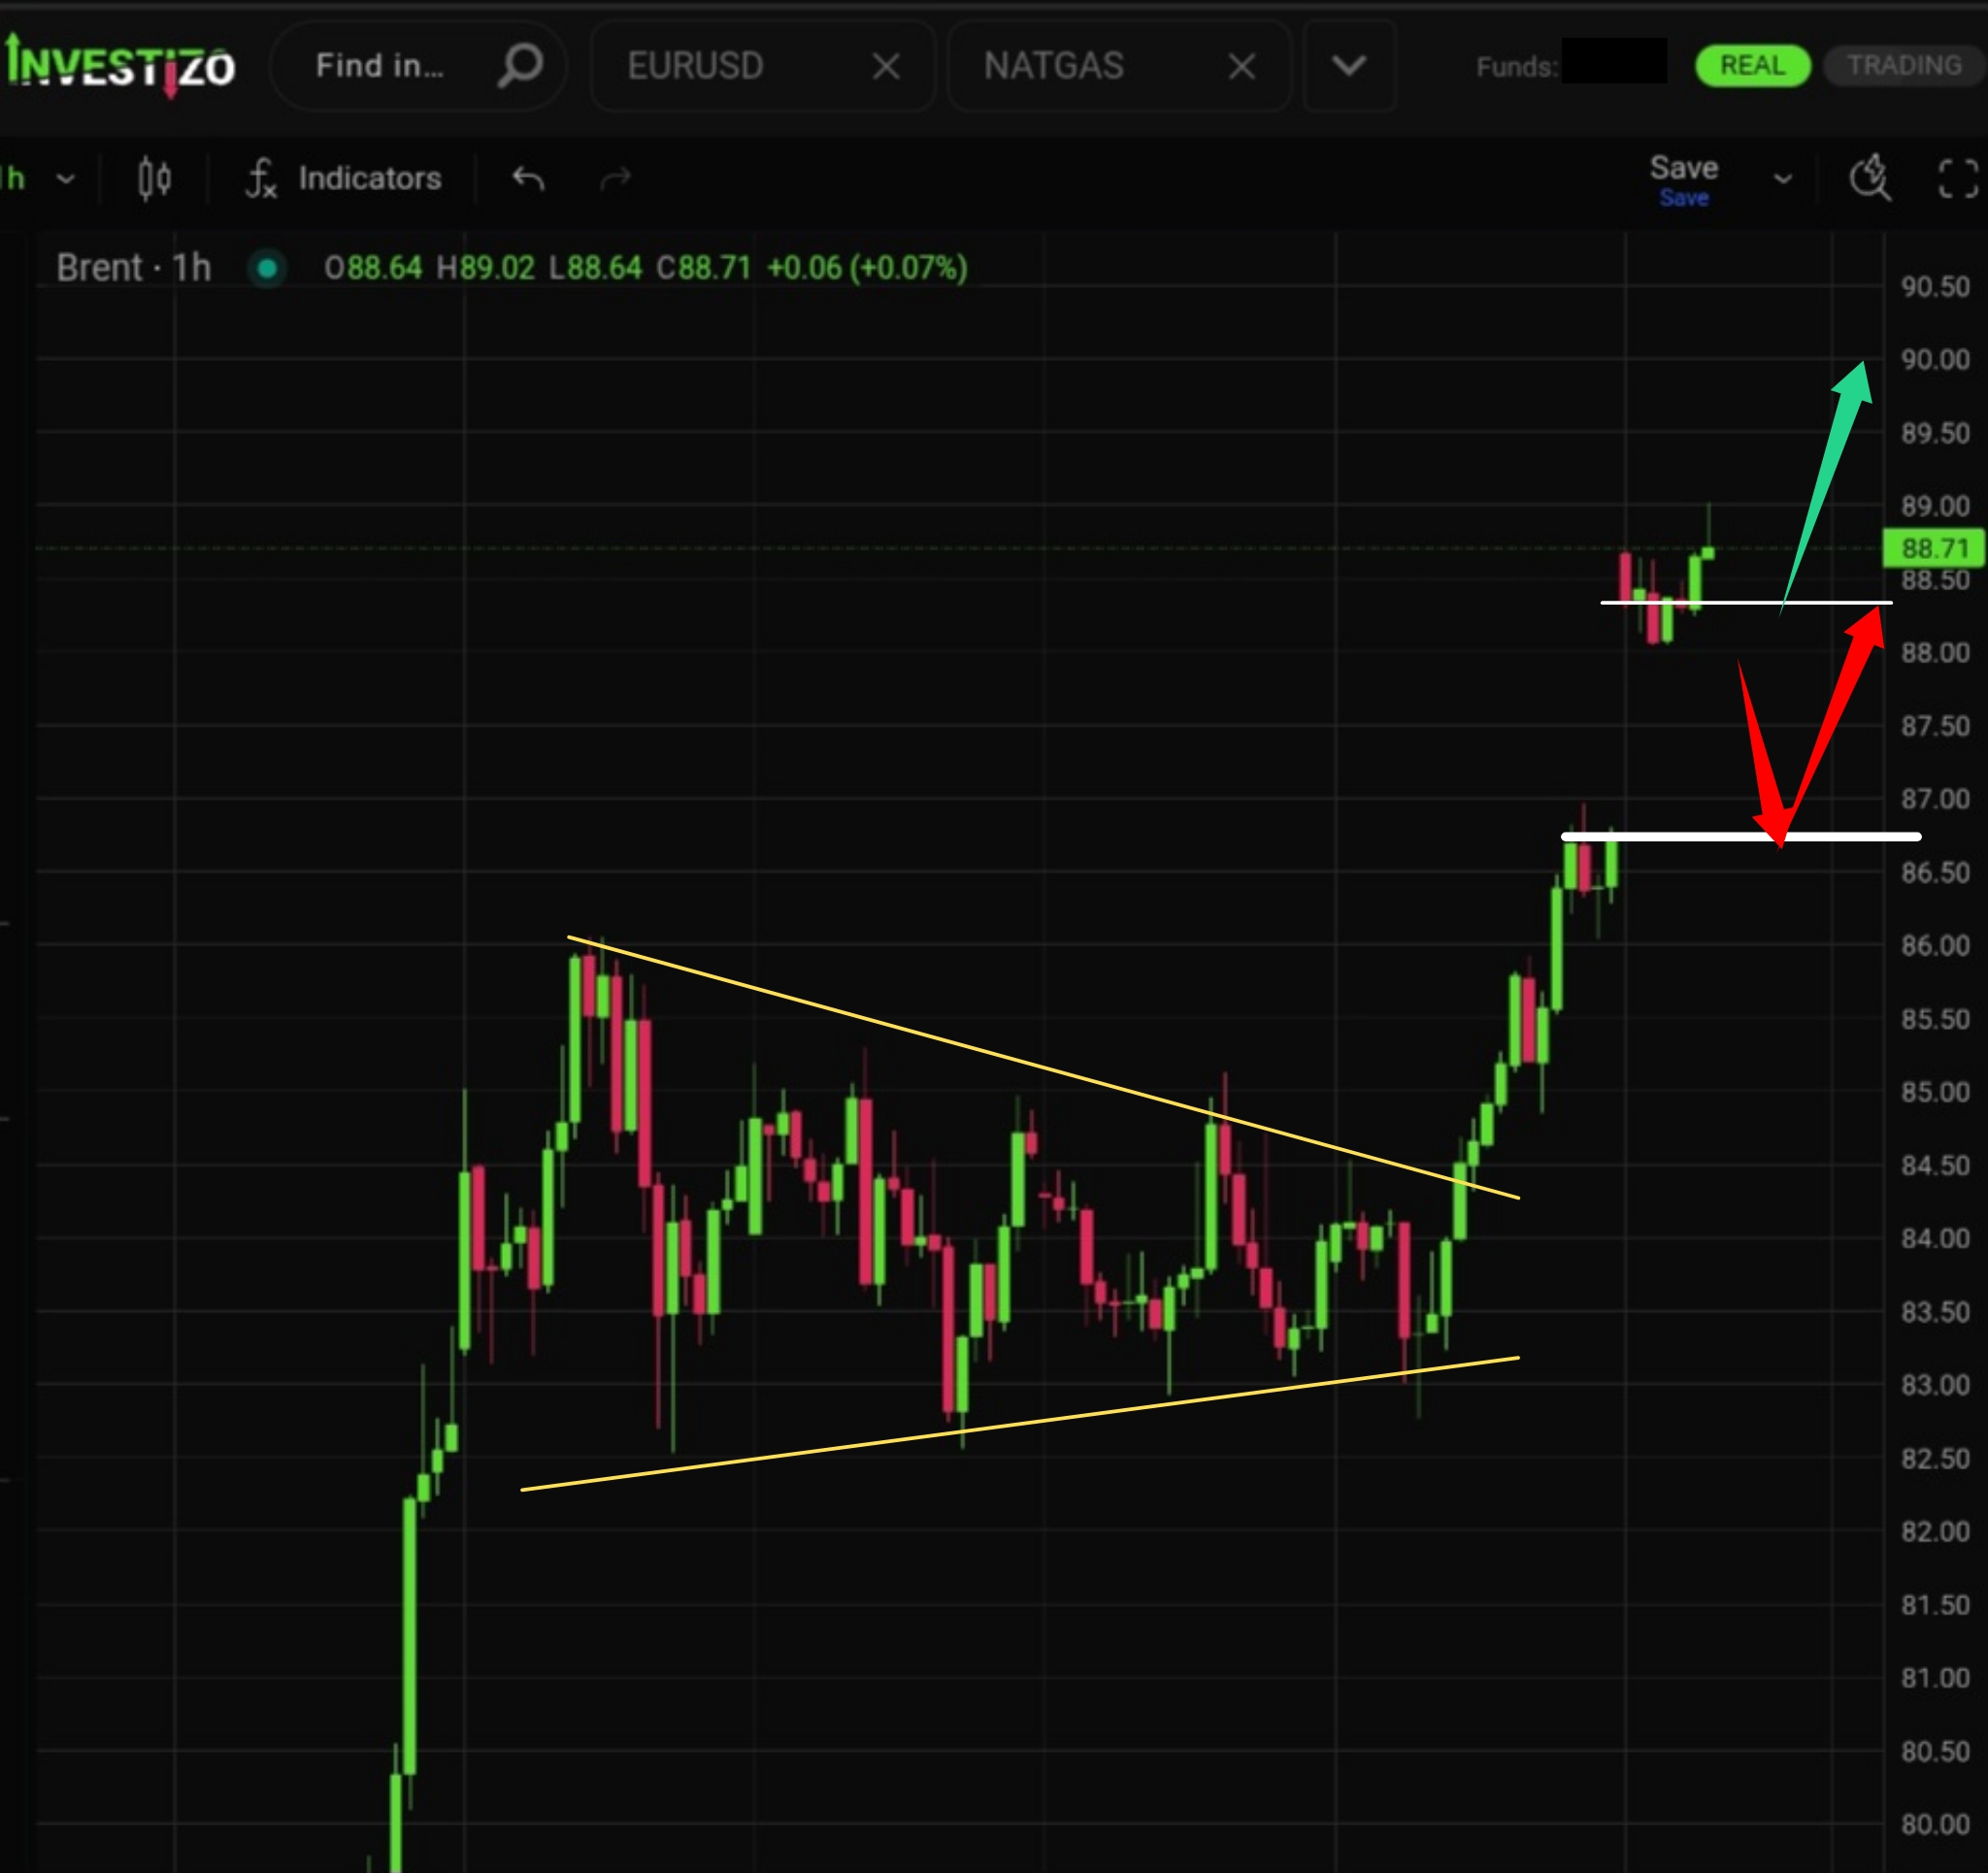
Brent Crude trades at 88.71 this Monday morning, opening the week with a massive upside gap in the region of 86.80 and sustaining its most explosive weekly rally since April.
The downward correction is targeting the strong support level at 1.3400, which represents a significant confluence zone.
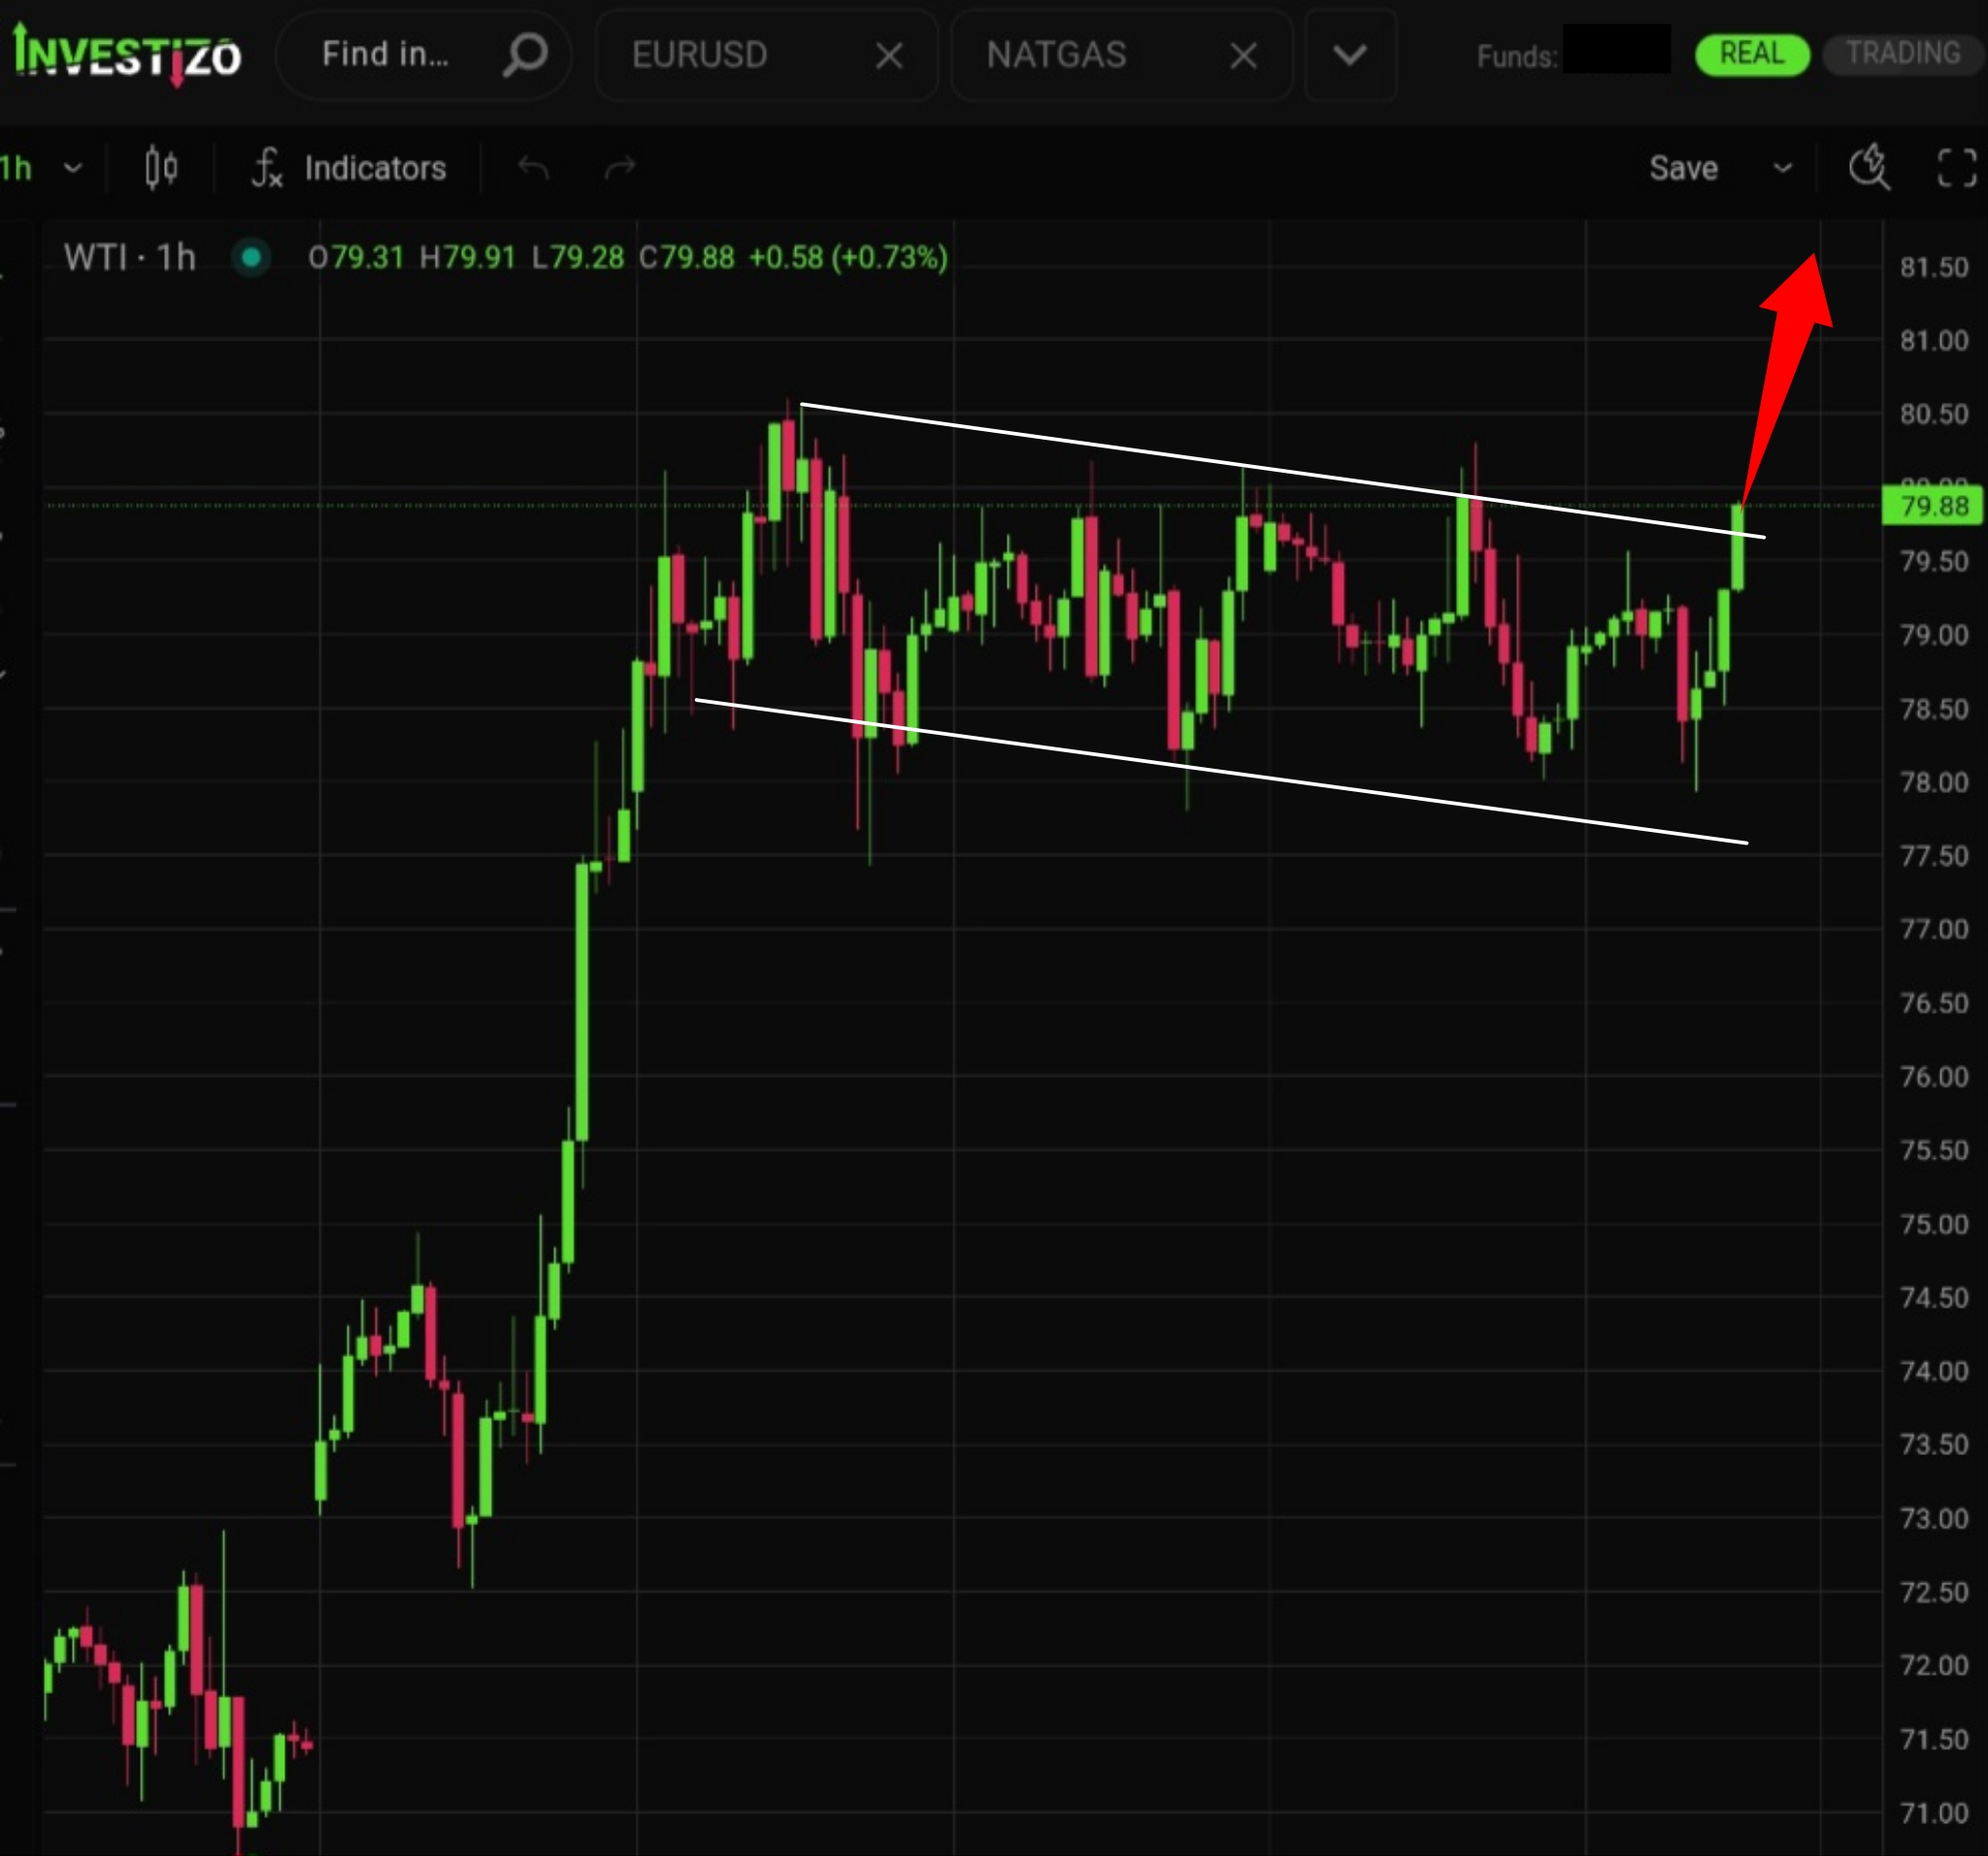
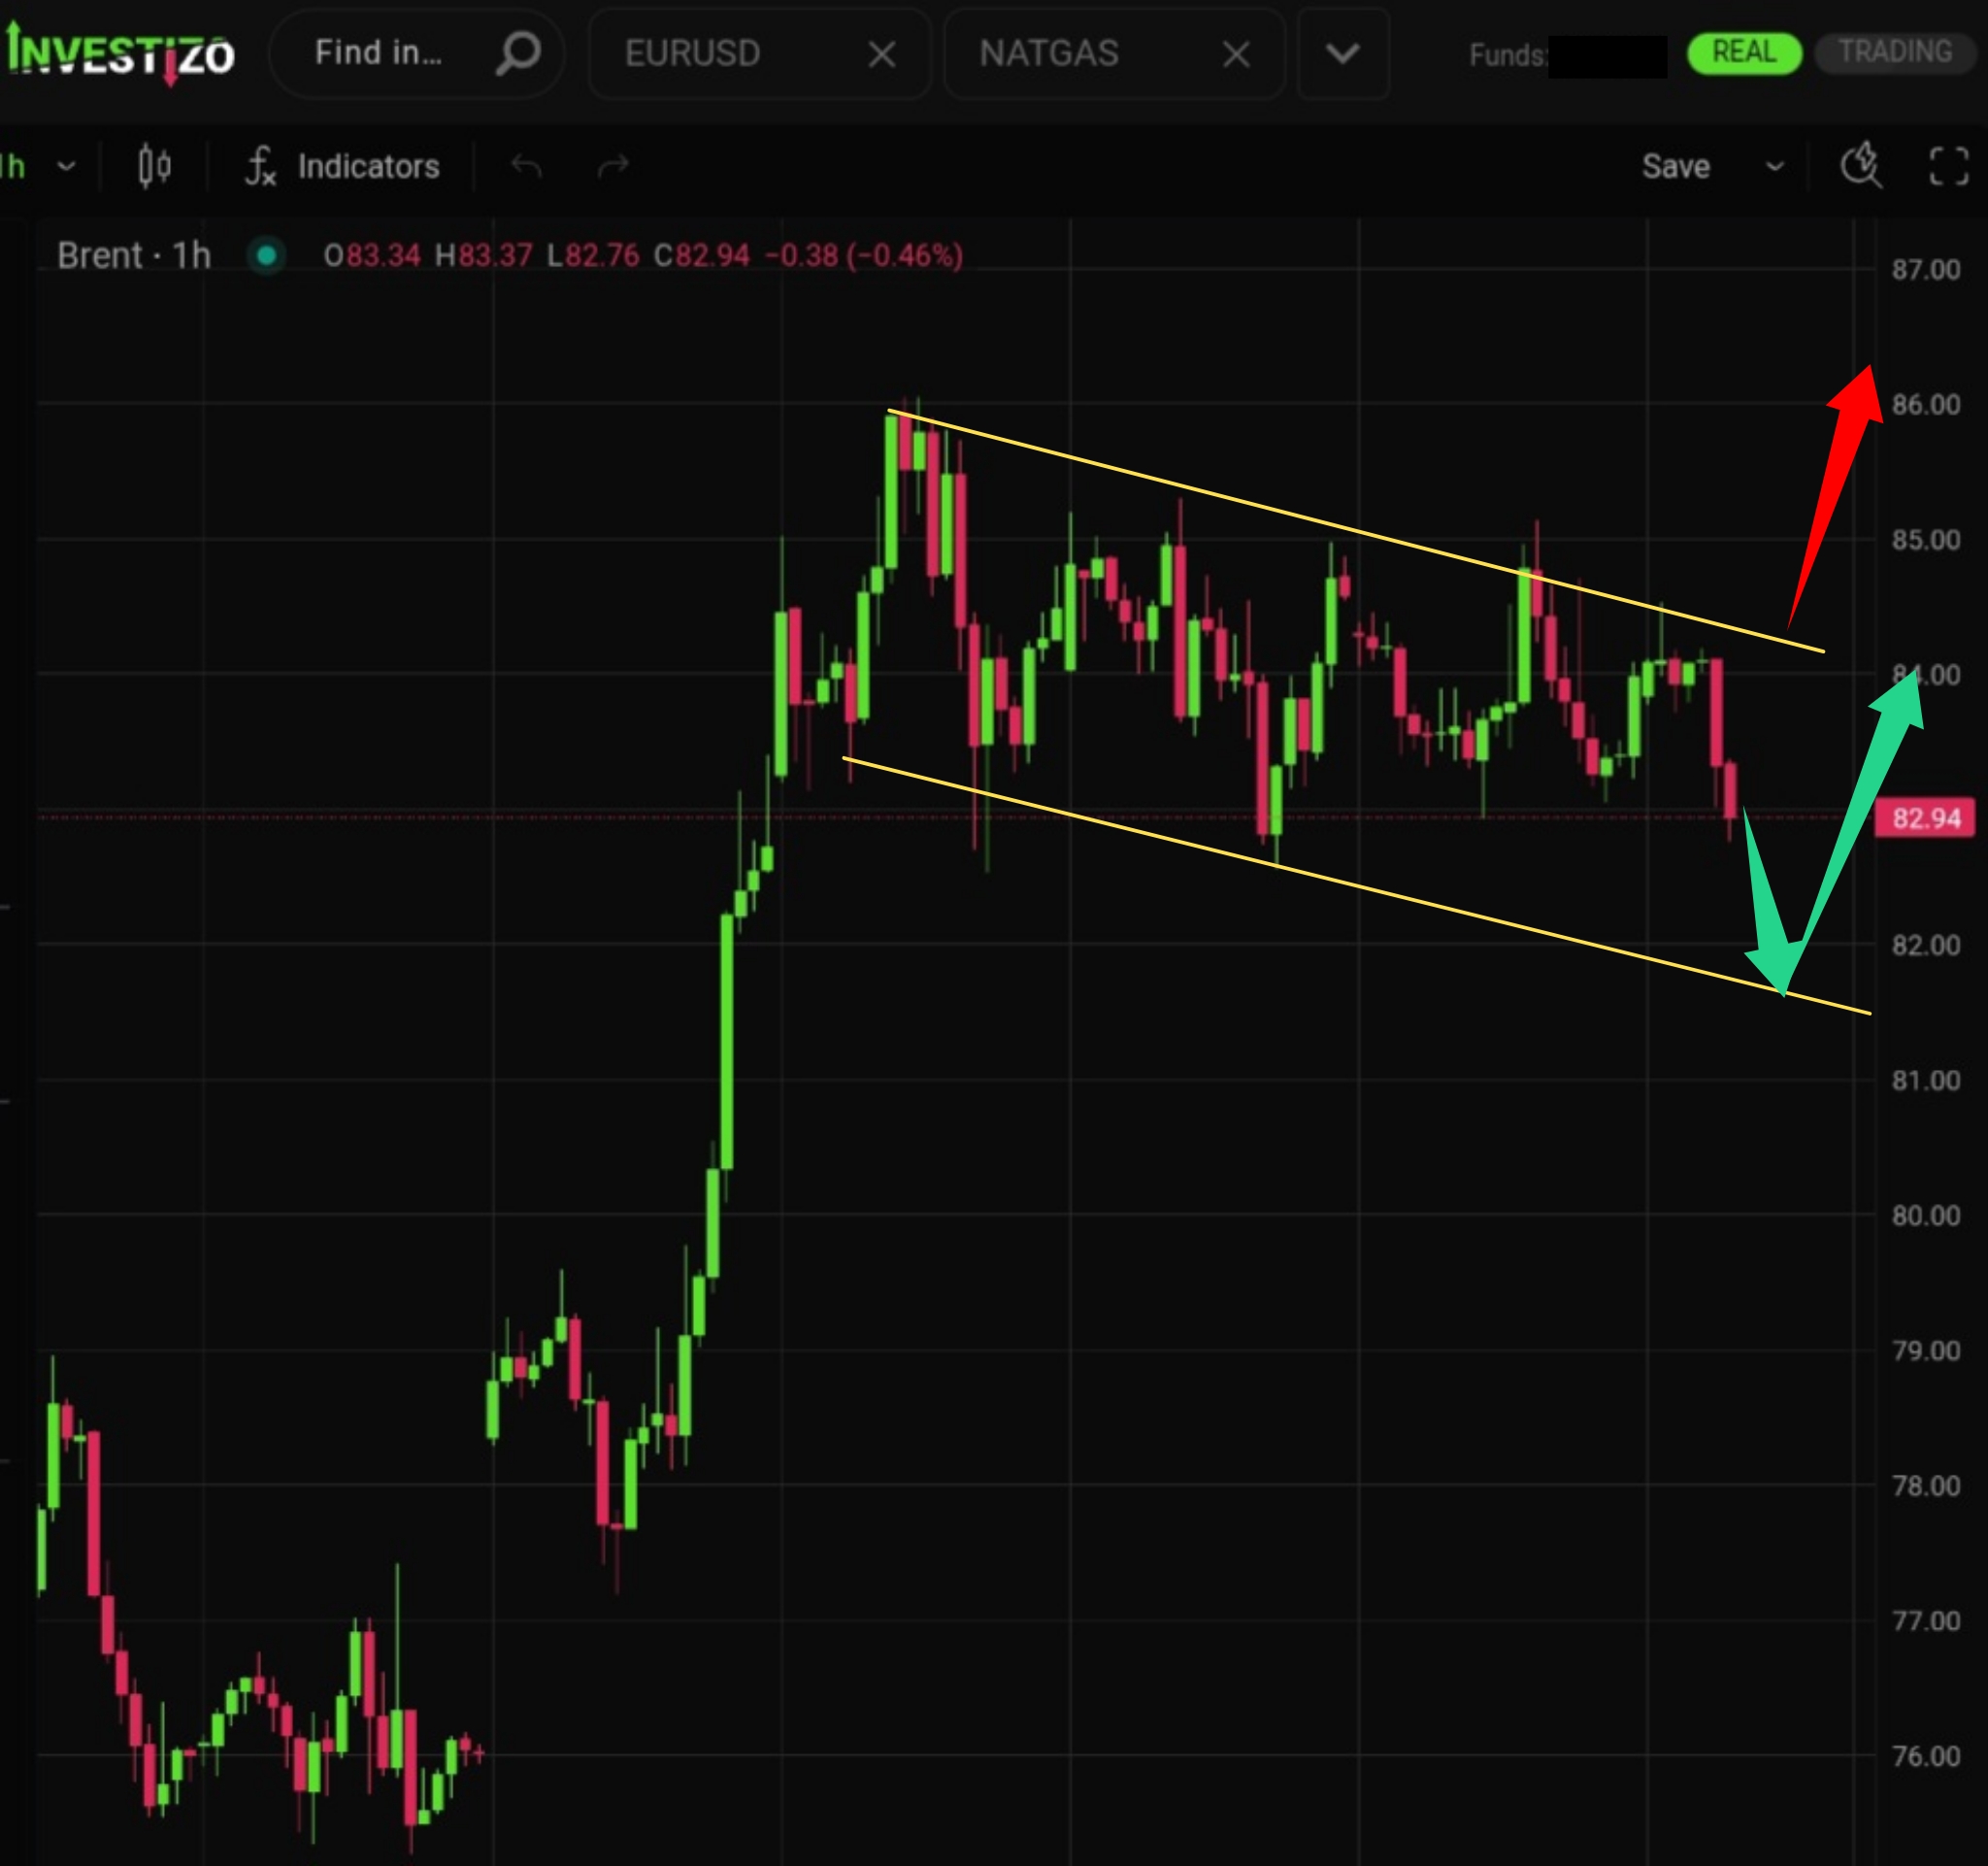
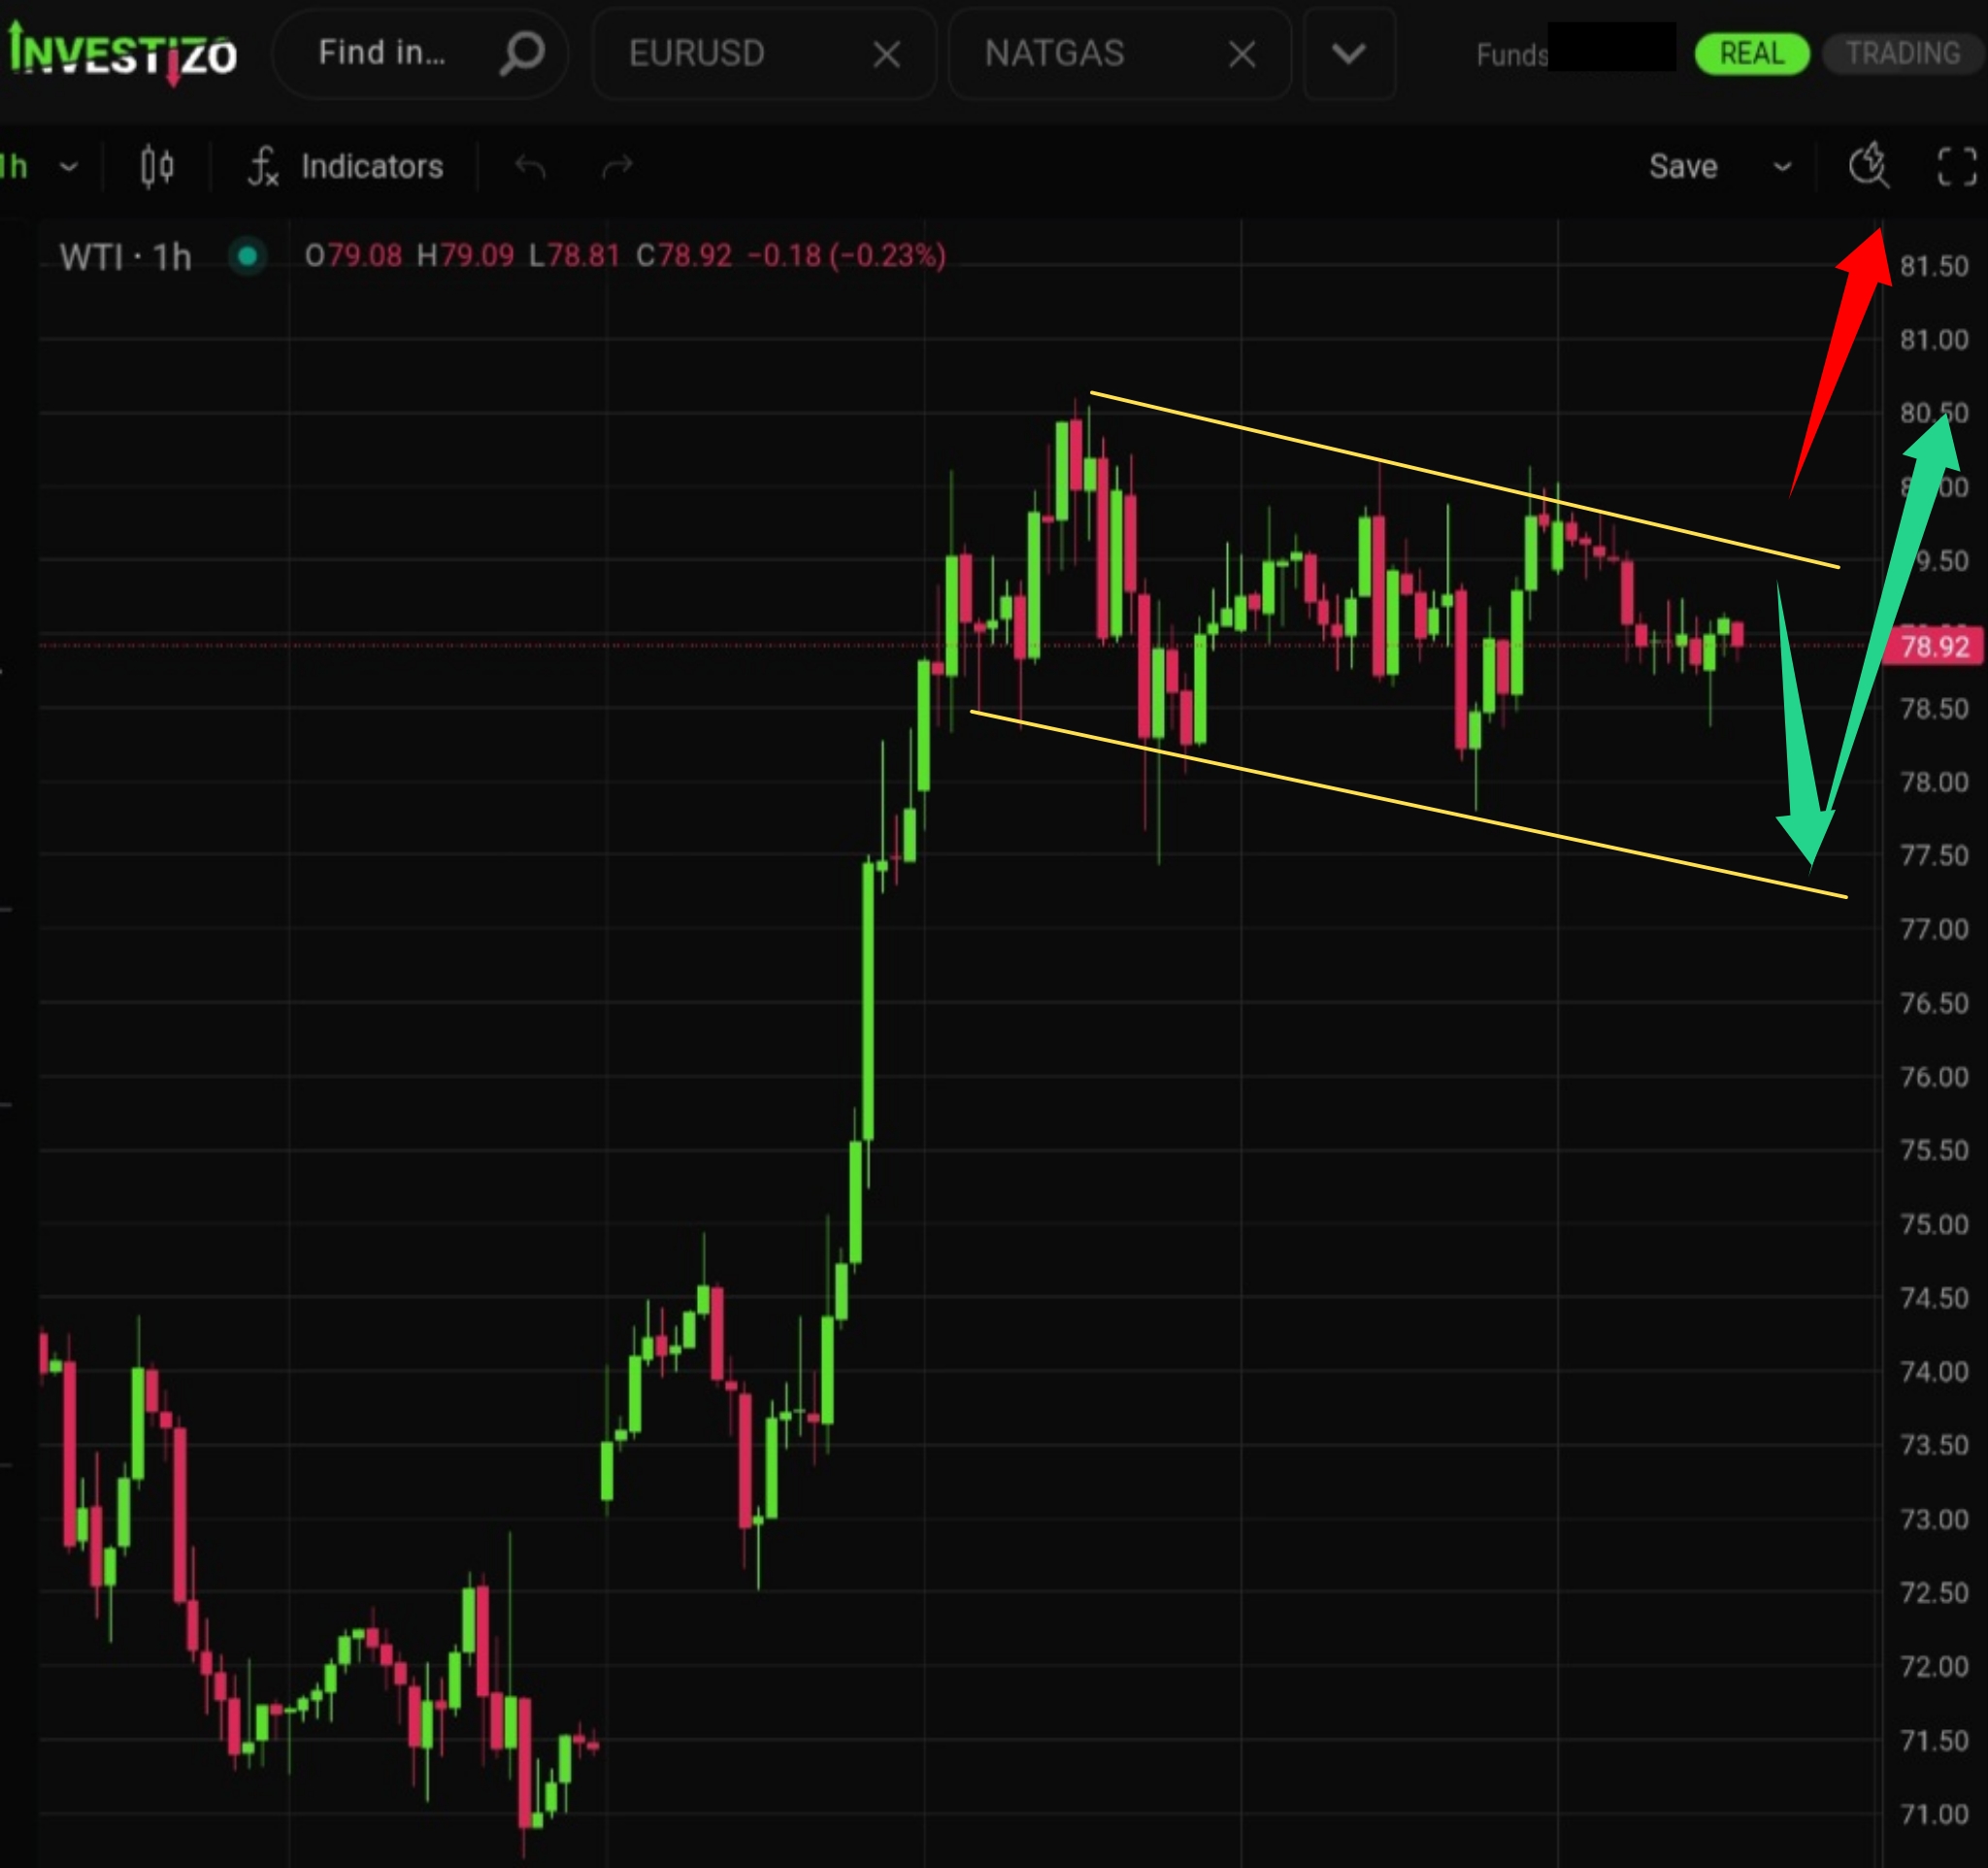
Oil is presumably breaking out of the “bull flag” pattern, which may signal an impending upward impulse.
The pair has already completed a 5-wave upward structure. As we have experienced, the market rarely delivers a seventh wave.
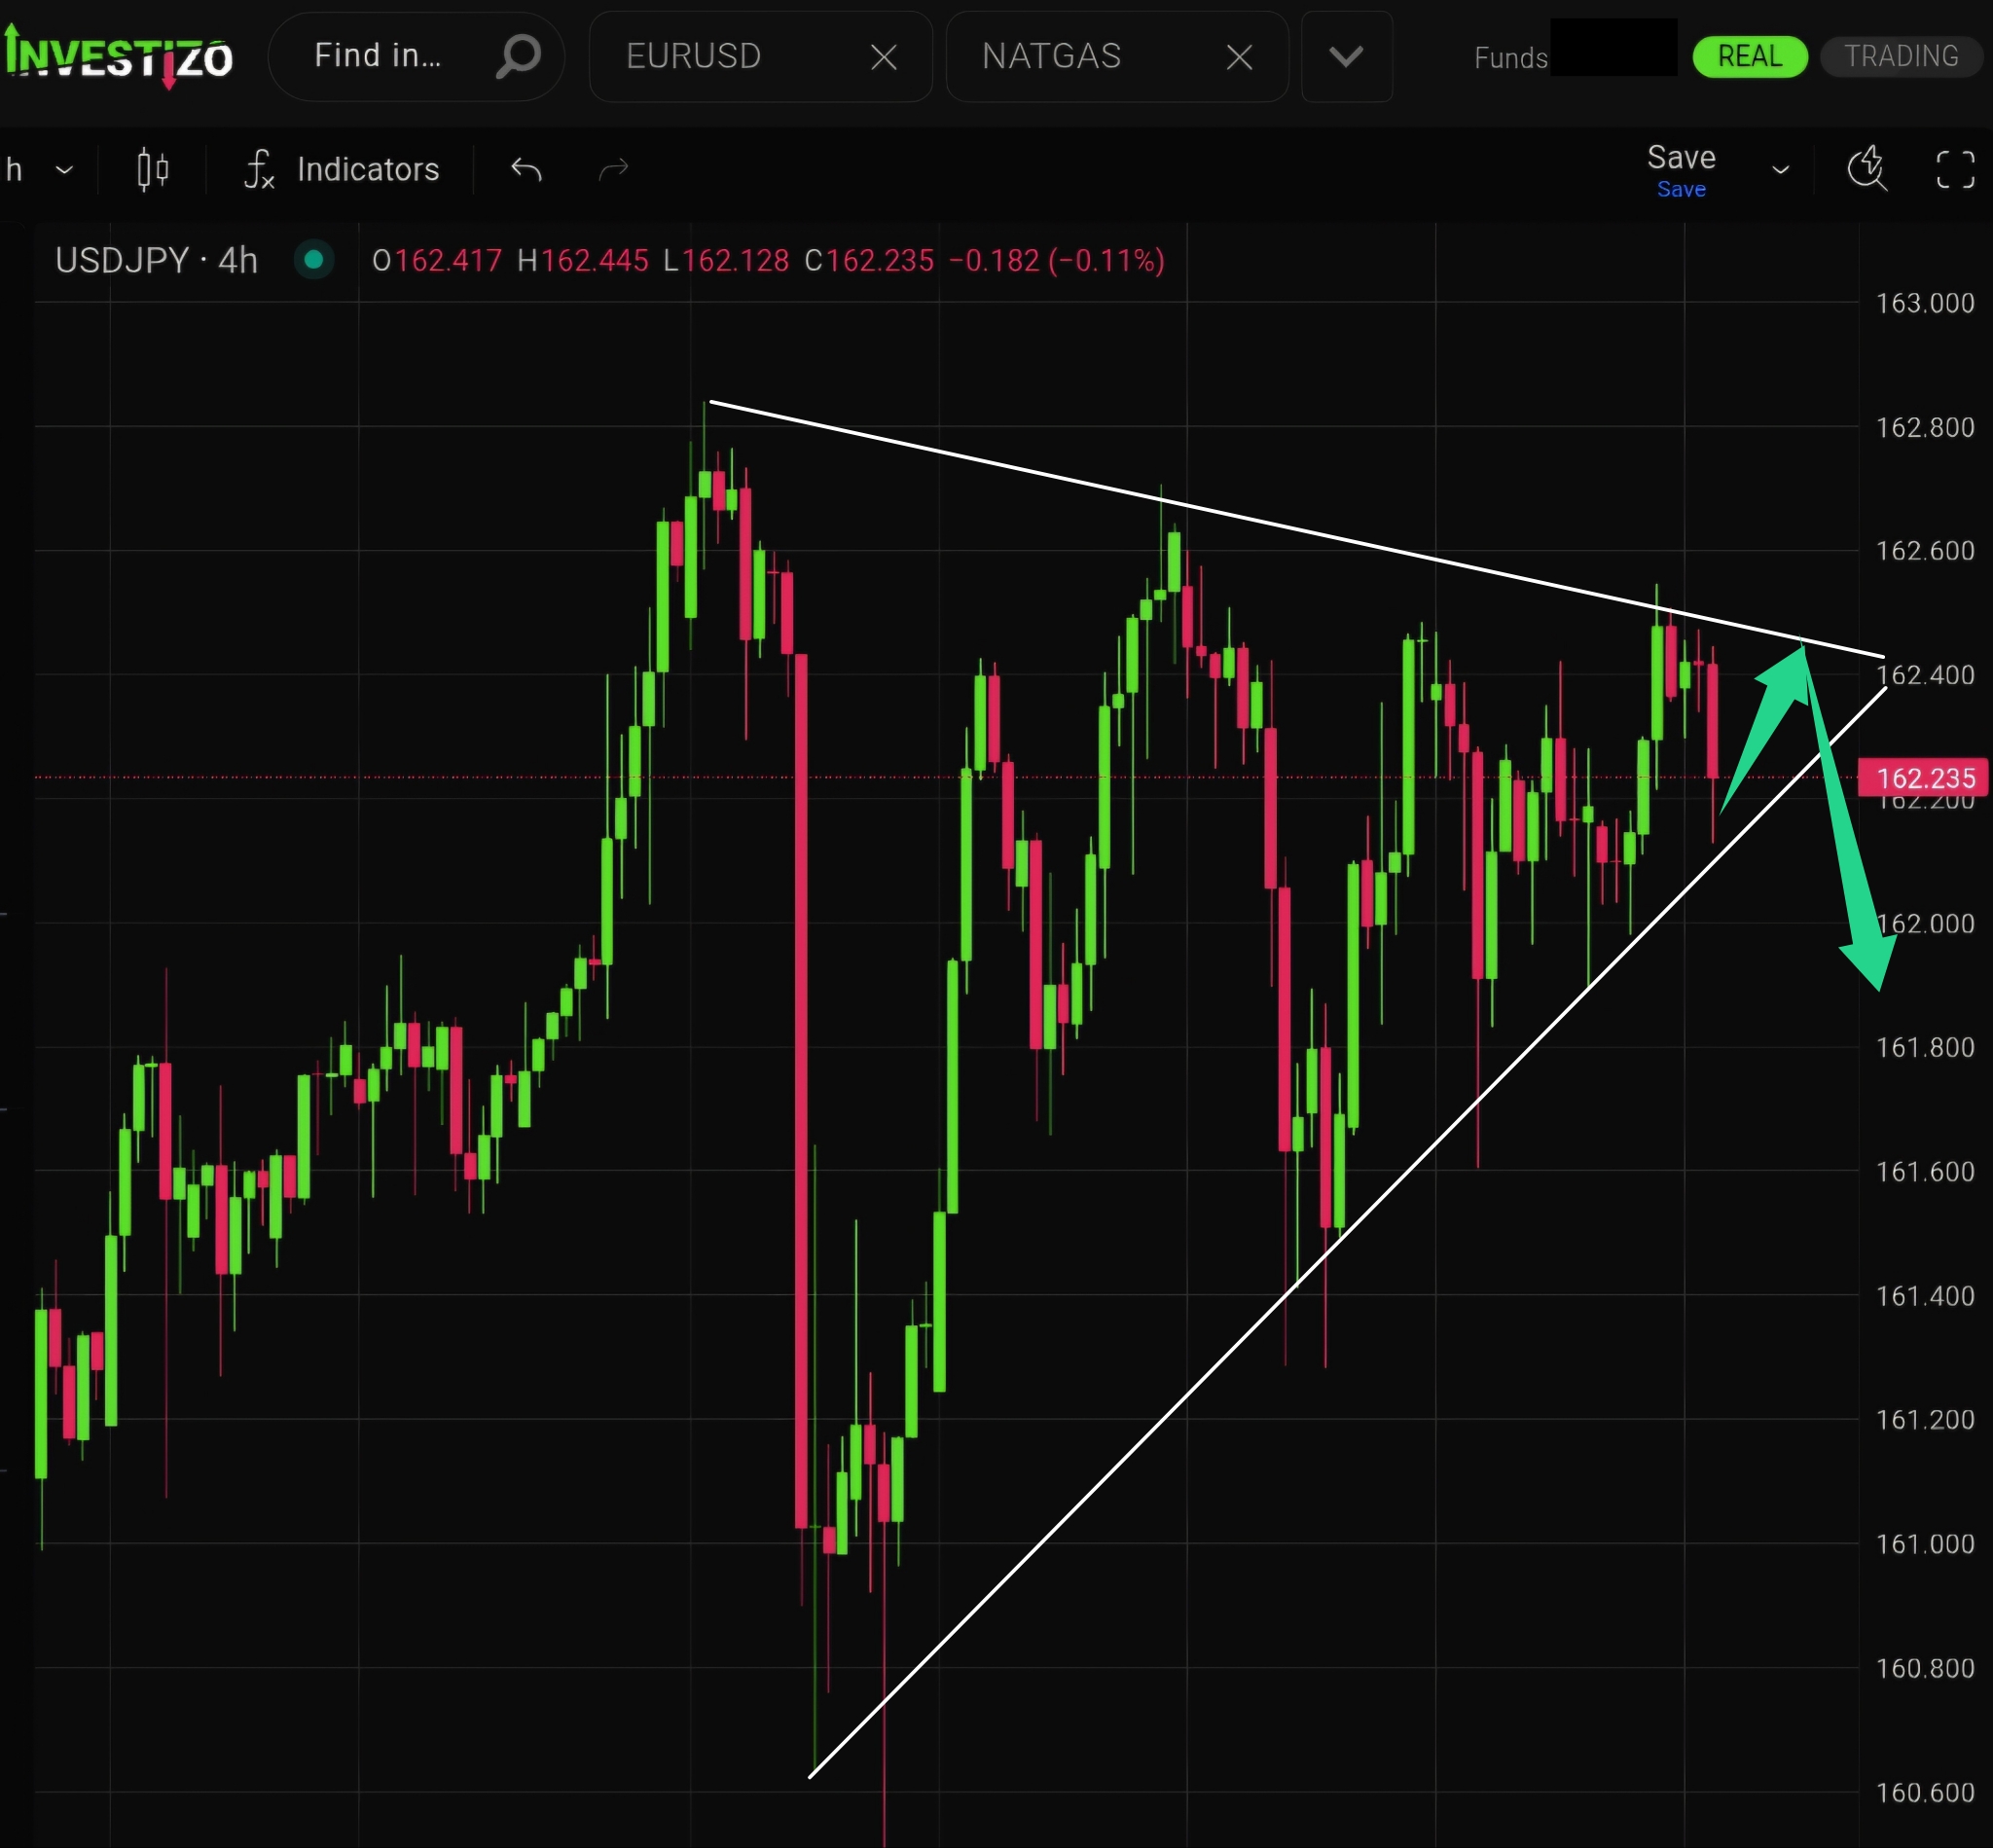
The pair is approaching the completion of the full triangle fill, within which price has been consolidating throughout the week.
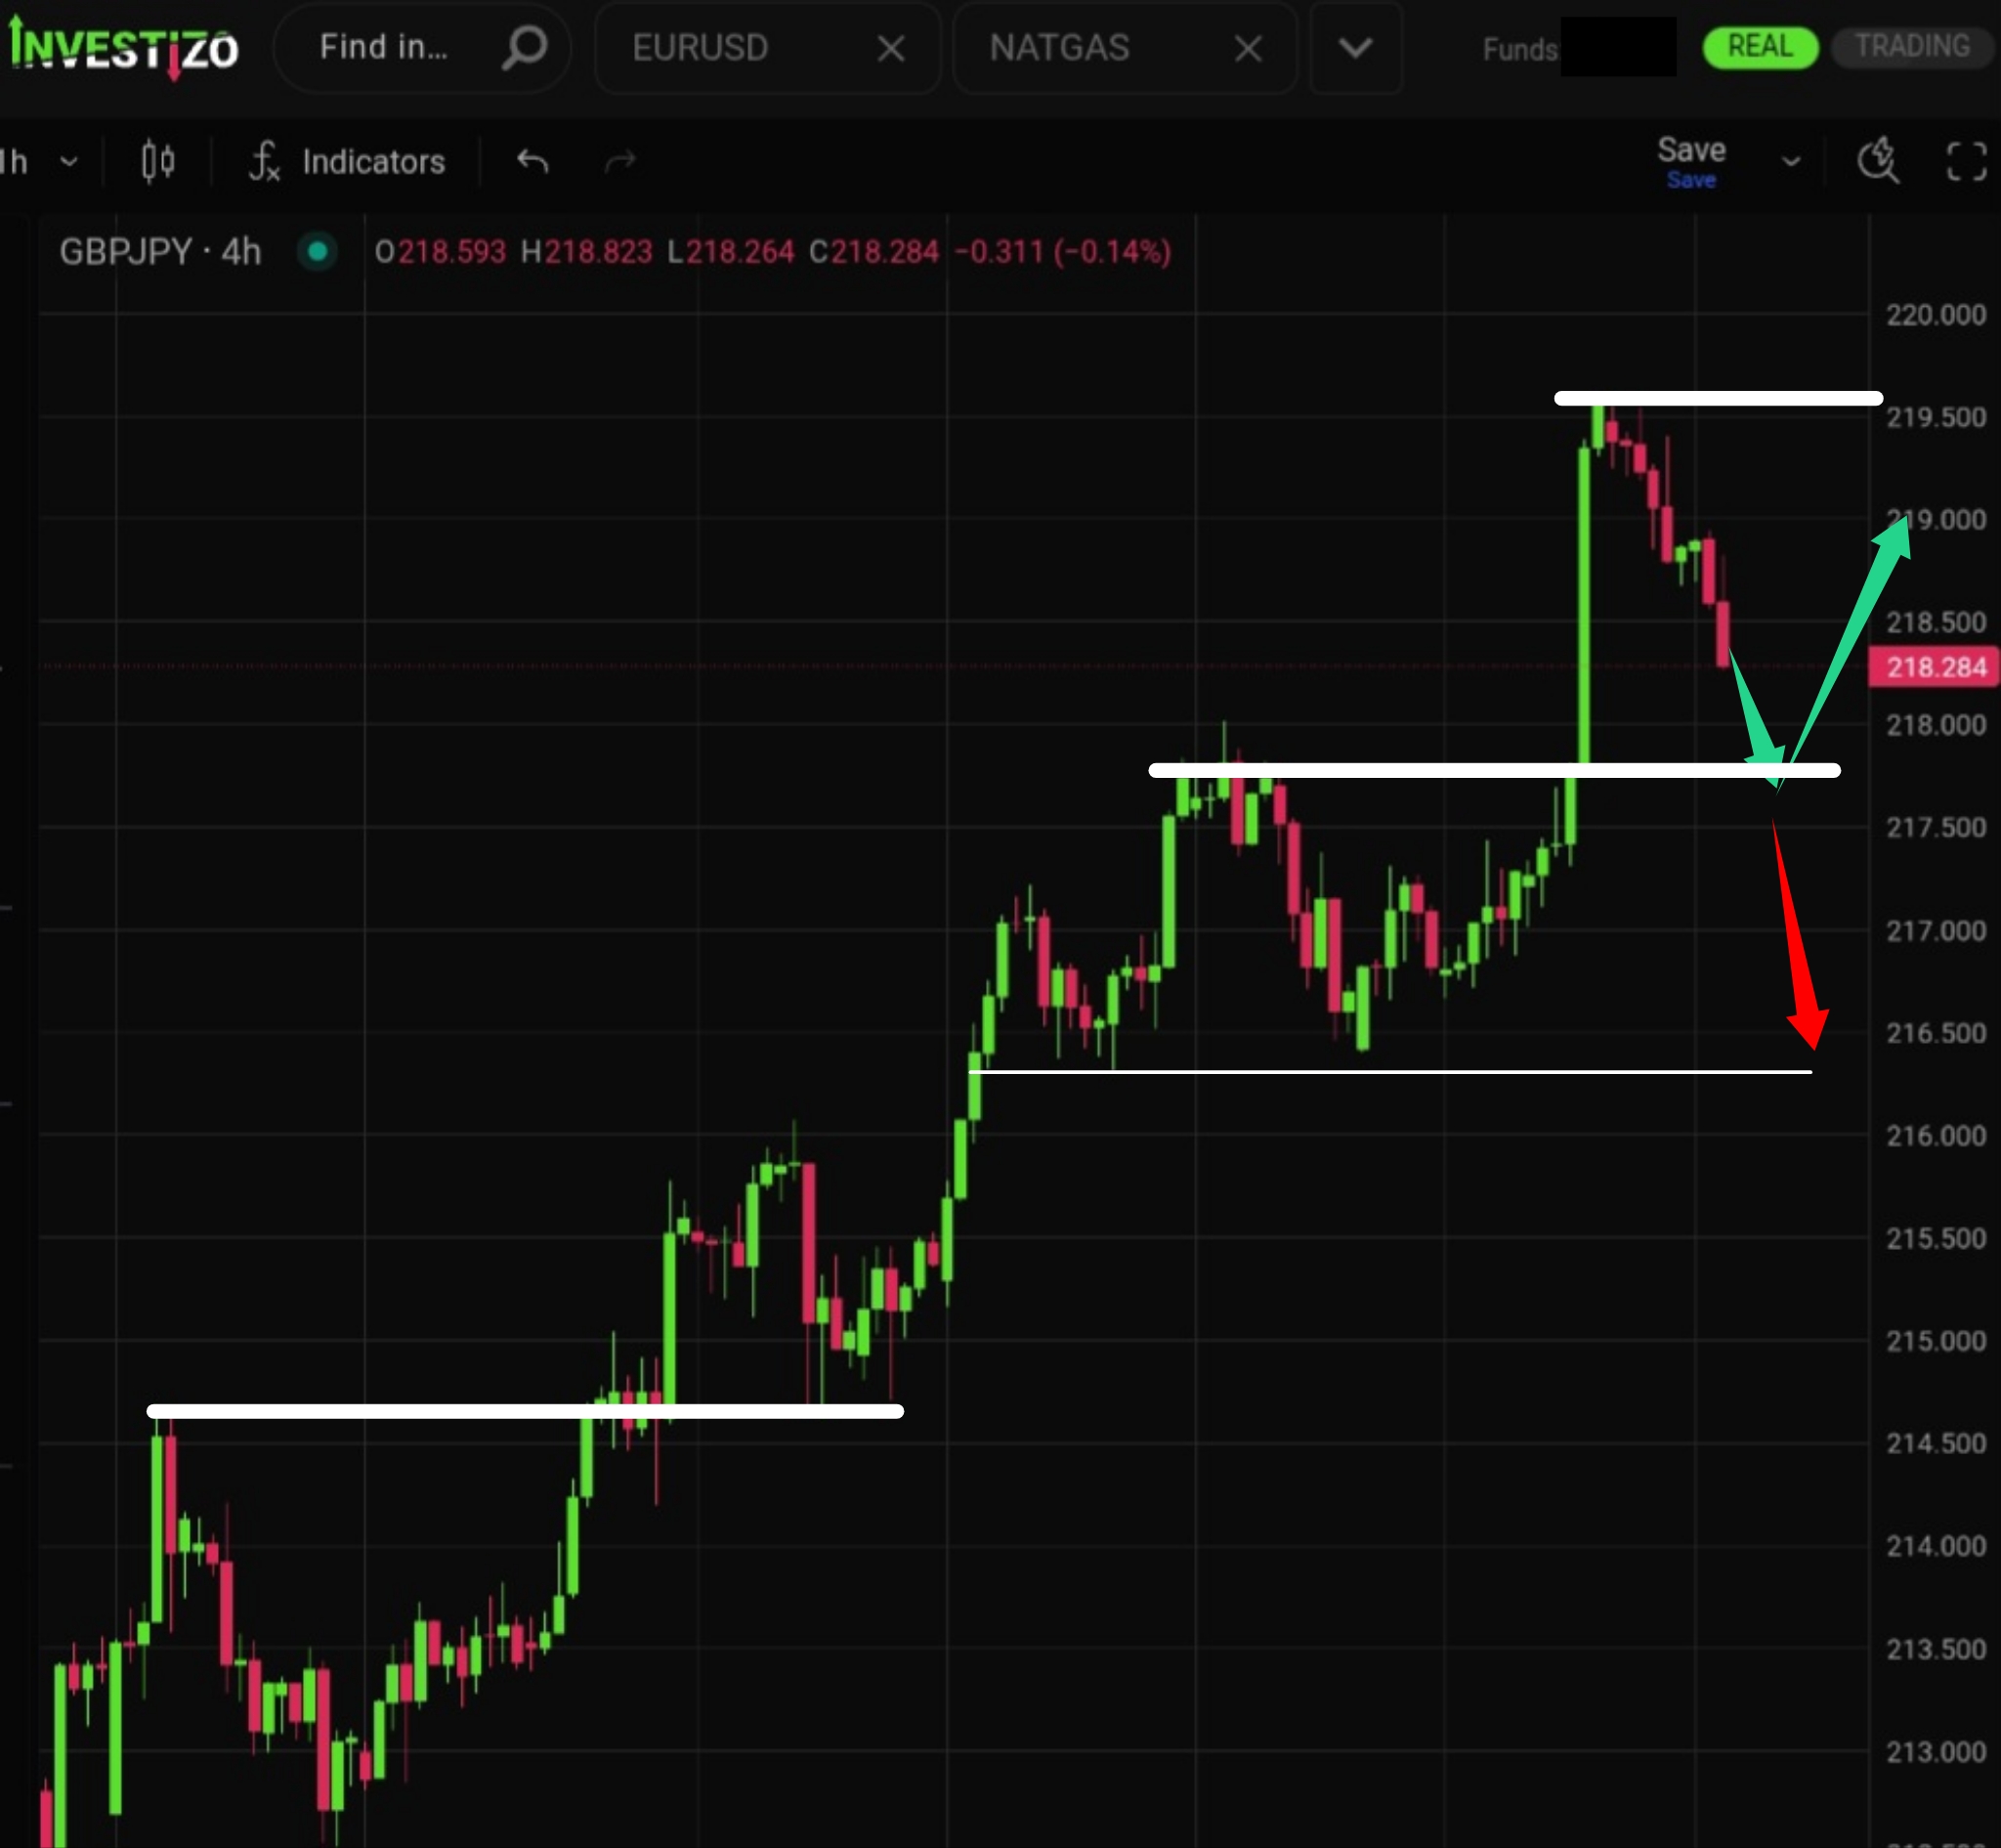
The downward technical correction phase appears to have concluded, enabling buyers to actively develop a new upward trending swing.
Bitcoin (BTC/USD) trades at 62,900 this Friday morning, retracing from its mid-week breakout attempt as political friction in Washington dampens speculative momentum.
Brent Crude trades at 82.95 this Friday morning, consolidating for a fourth consecutive session within the 83.00 to 85.00 corridor.
A large “bull flag” continuation pattern has formed, signaling strong potential for further upside.