
Bitcoin, Technical Analysis – H1
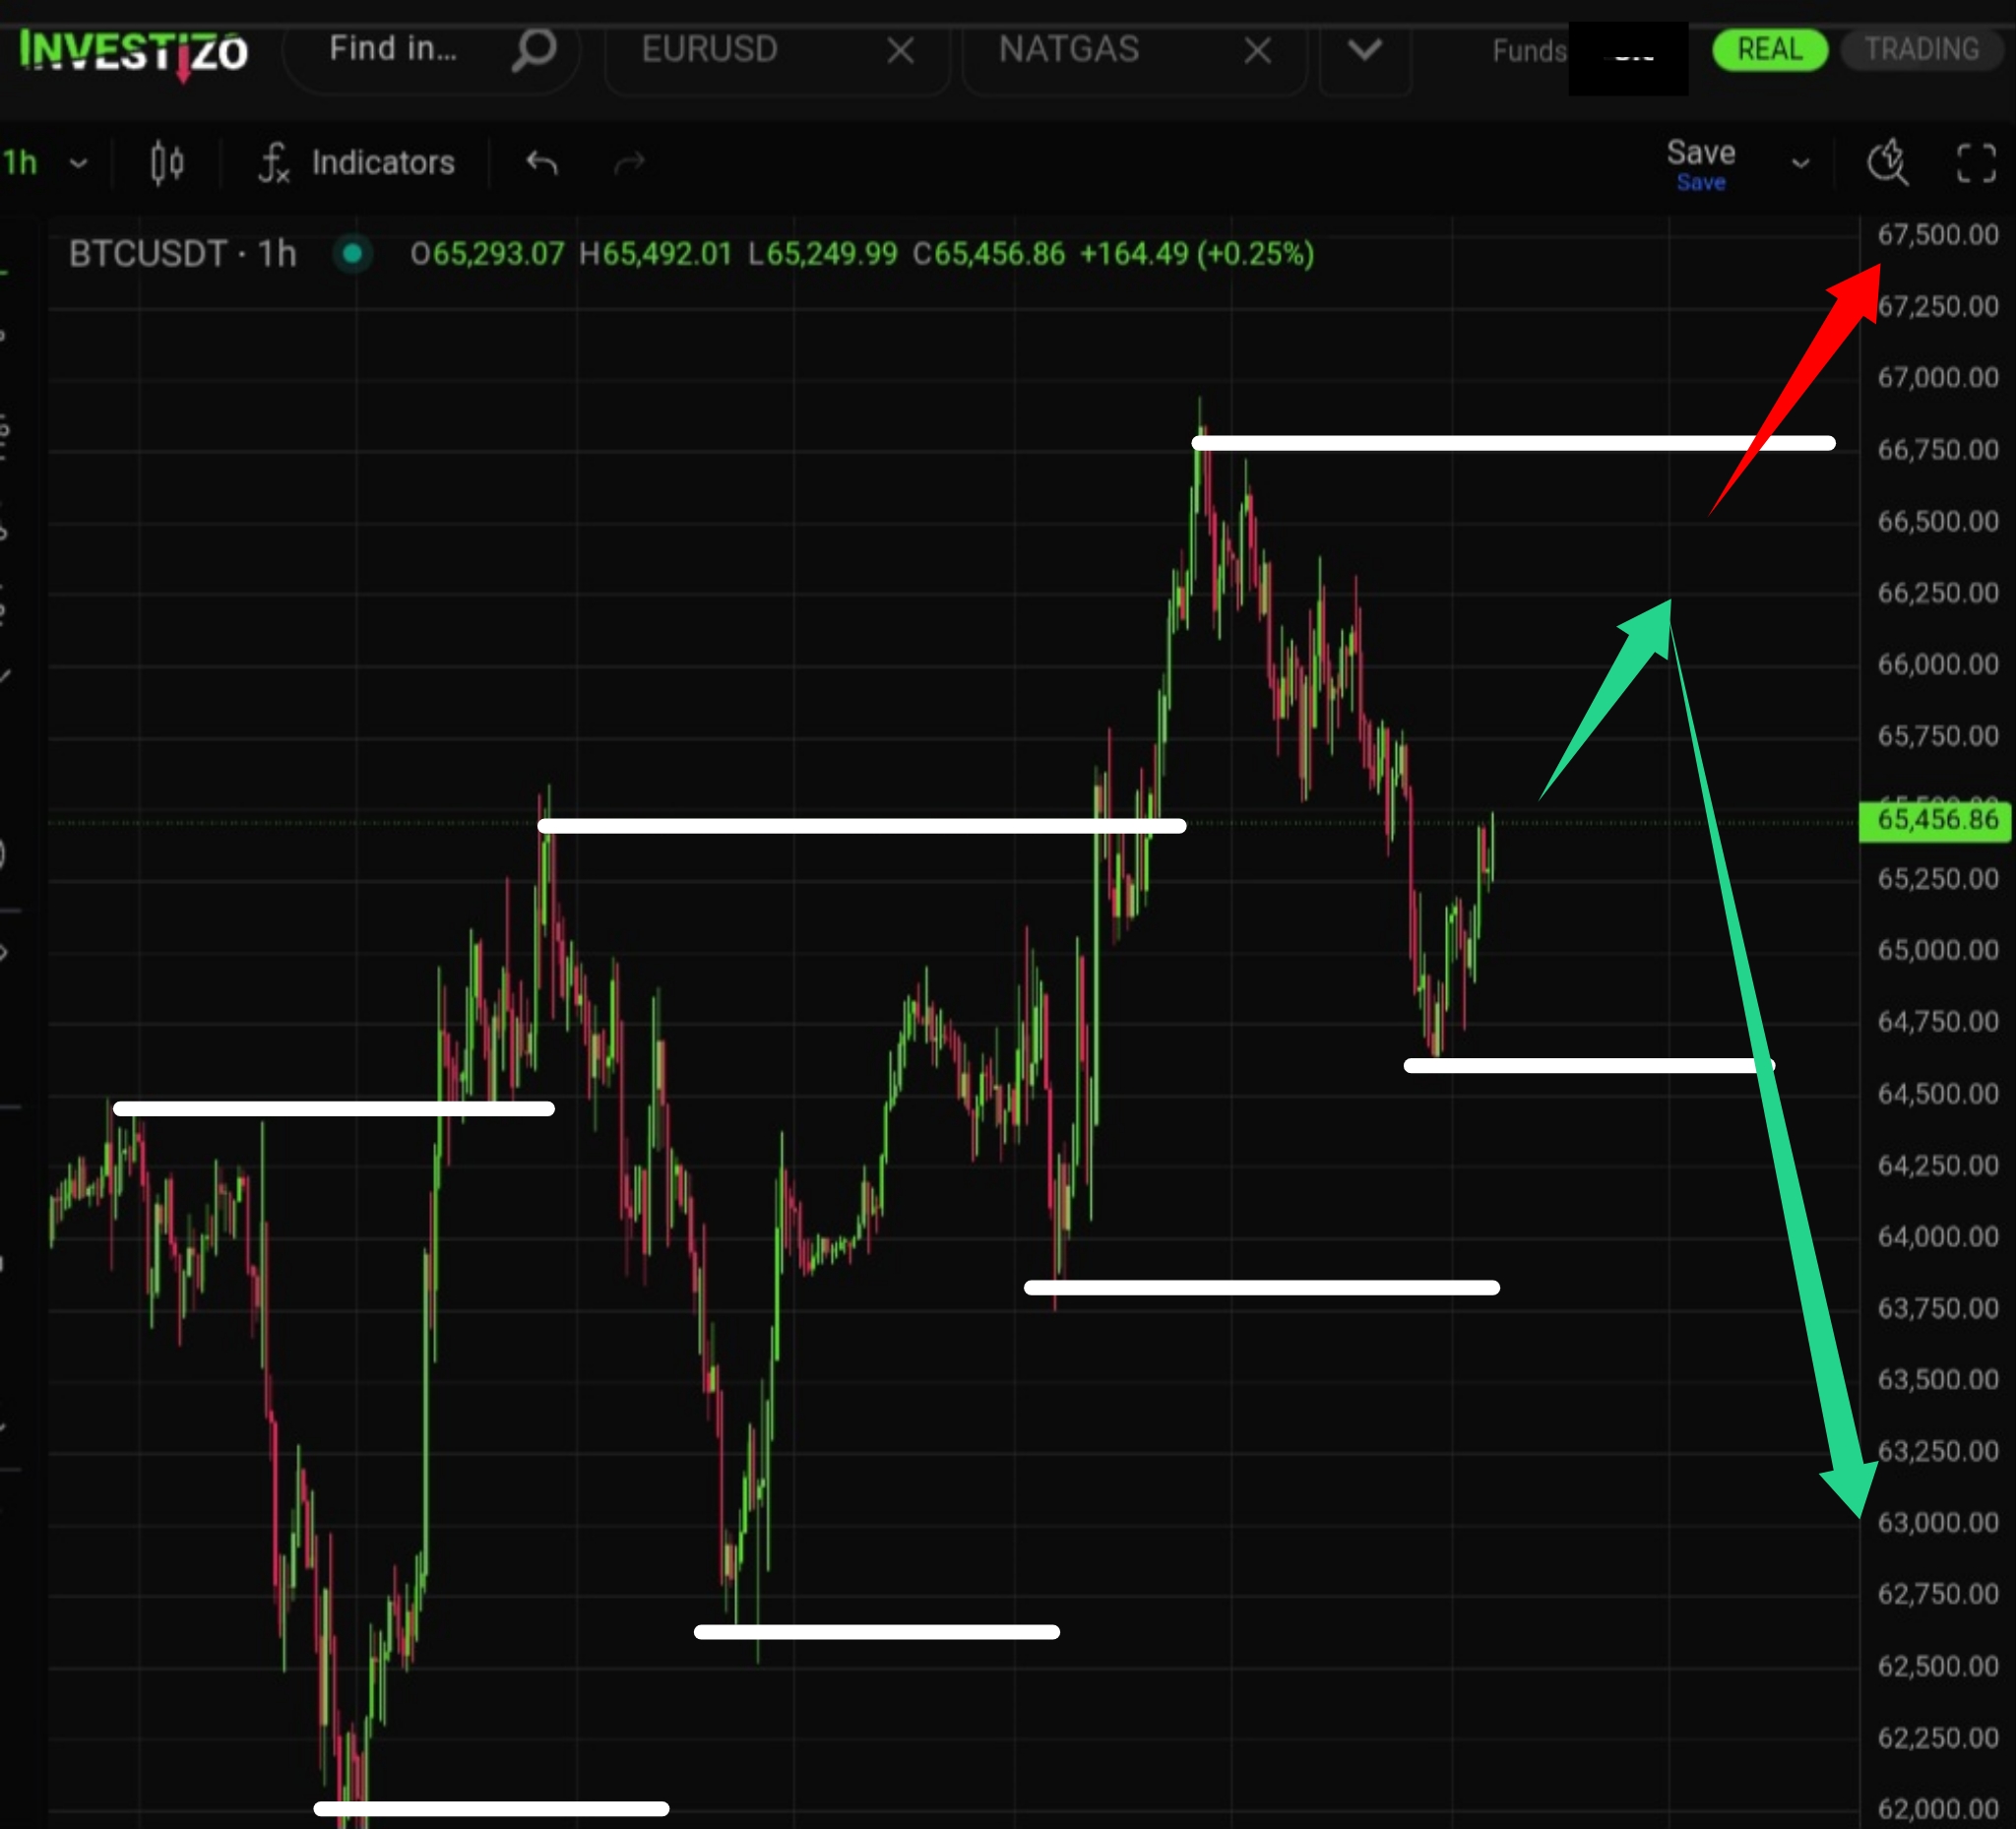
The medium-term structure remains bullish for now, with consistently higher local lows and renewed highs. However, sellers continue to exert pressure on higher timeframes, meaning bulls face a challenging task in achieving another all-time high. Failure to do so could signal a shift to a downtrend on the hourly chart as well, followed by a breakdown of supports spaced roughly $1,000 apart ($64,500, $63,500, $62,500).
Key Levels:
□ $66,000 (key resistance / buyer fatigue zone)
□ $64,500 (first major support)
□ $63,500 (secondary support)
□ $62,500 (deeper support level)
Primary Scenario:
Buyer exhaustion near $66,000, followed by a decline toward $64,500, with further targets at $63,500 and $62,500.
Alternative Scenario:
A decisive breakout above $67,000.
Analyst Commentary:
The primary scenario appears significantly more probable.