Technical analysis USDJPY for 17.10.2024
17.10.2024 08:52
Intraday
Technical
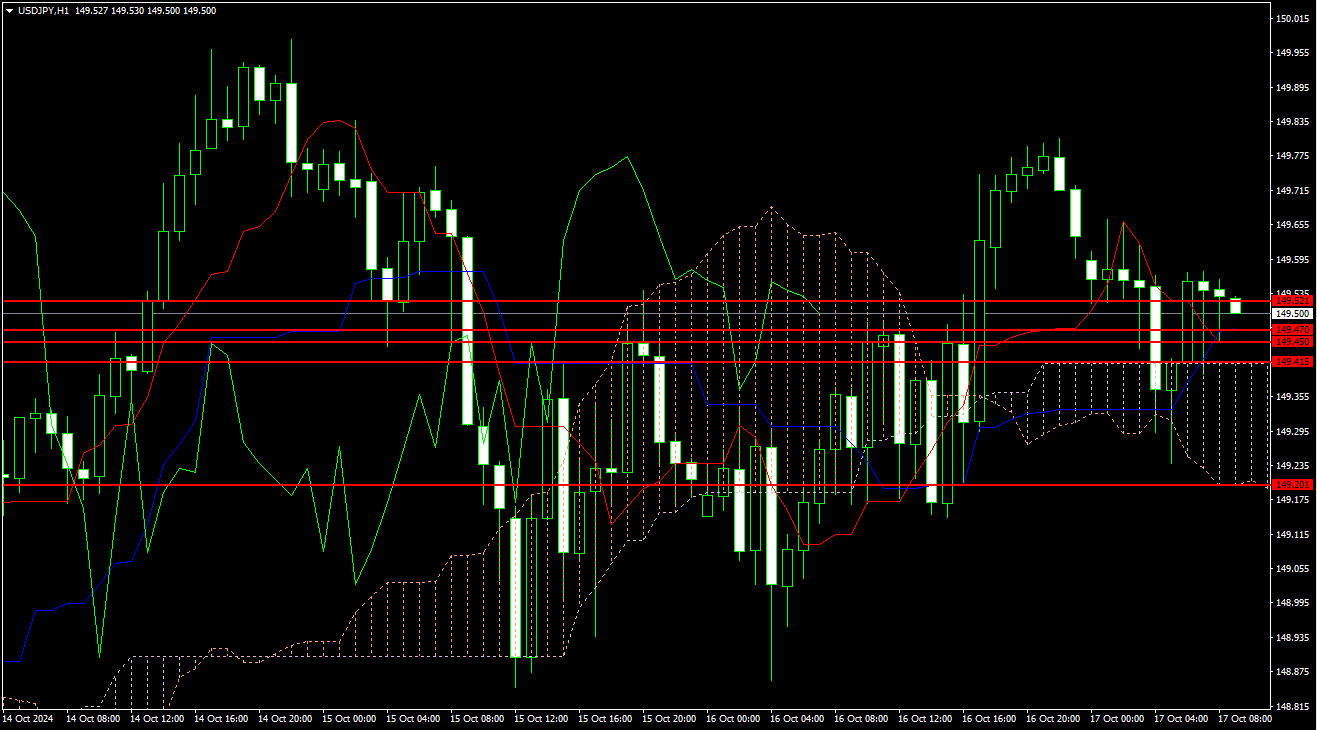
The Tenkan-sen line is located below the Kijun-sen line. Red points downwards while blue points upwards. Confirmatory line Chikou Span is above the price chart. In this case, the cloud is descending. Instrument is trading above the Tenkan-se and Kijun-sen lines. The closest support and resistance levels are Kijun-sen and Tenkan-se, respectively. The closest support and resistance levels are Kijun-sen and Tenkan-se, respectively
Key levels
149.201, 149.415, 149.450, 149.470, 149.520
Trading scenario
Recommended opening short positions (Sell) at the current price, with Take Profit of 149.450 and Stop Loss of 149.520
Alternative scenario
Recommended opening short positions (Sell Stop) from the level of 149.450, with Take Profit of 149.415 and Stop Loss of 149.520
Scenario
Recommendation
SELL
Entry Point
149.470
Take Profit
149.450
Stop Loss
149.520
Key Levels
149.201, 149.415, 149.450, 149.470, 149.520
Alternative scenario
Recommendation
SELL STOP
Entry Point
149.450
Take Profit
149.415
Stop Loss
149.520