Bitcoin (BTC/USD), Technical Analysis – H4
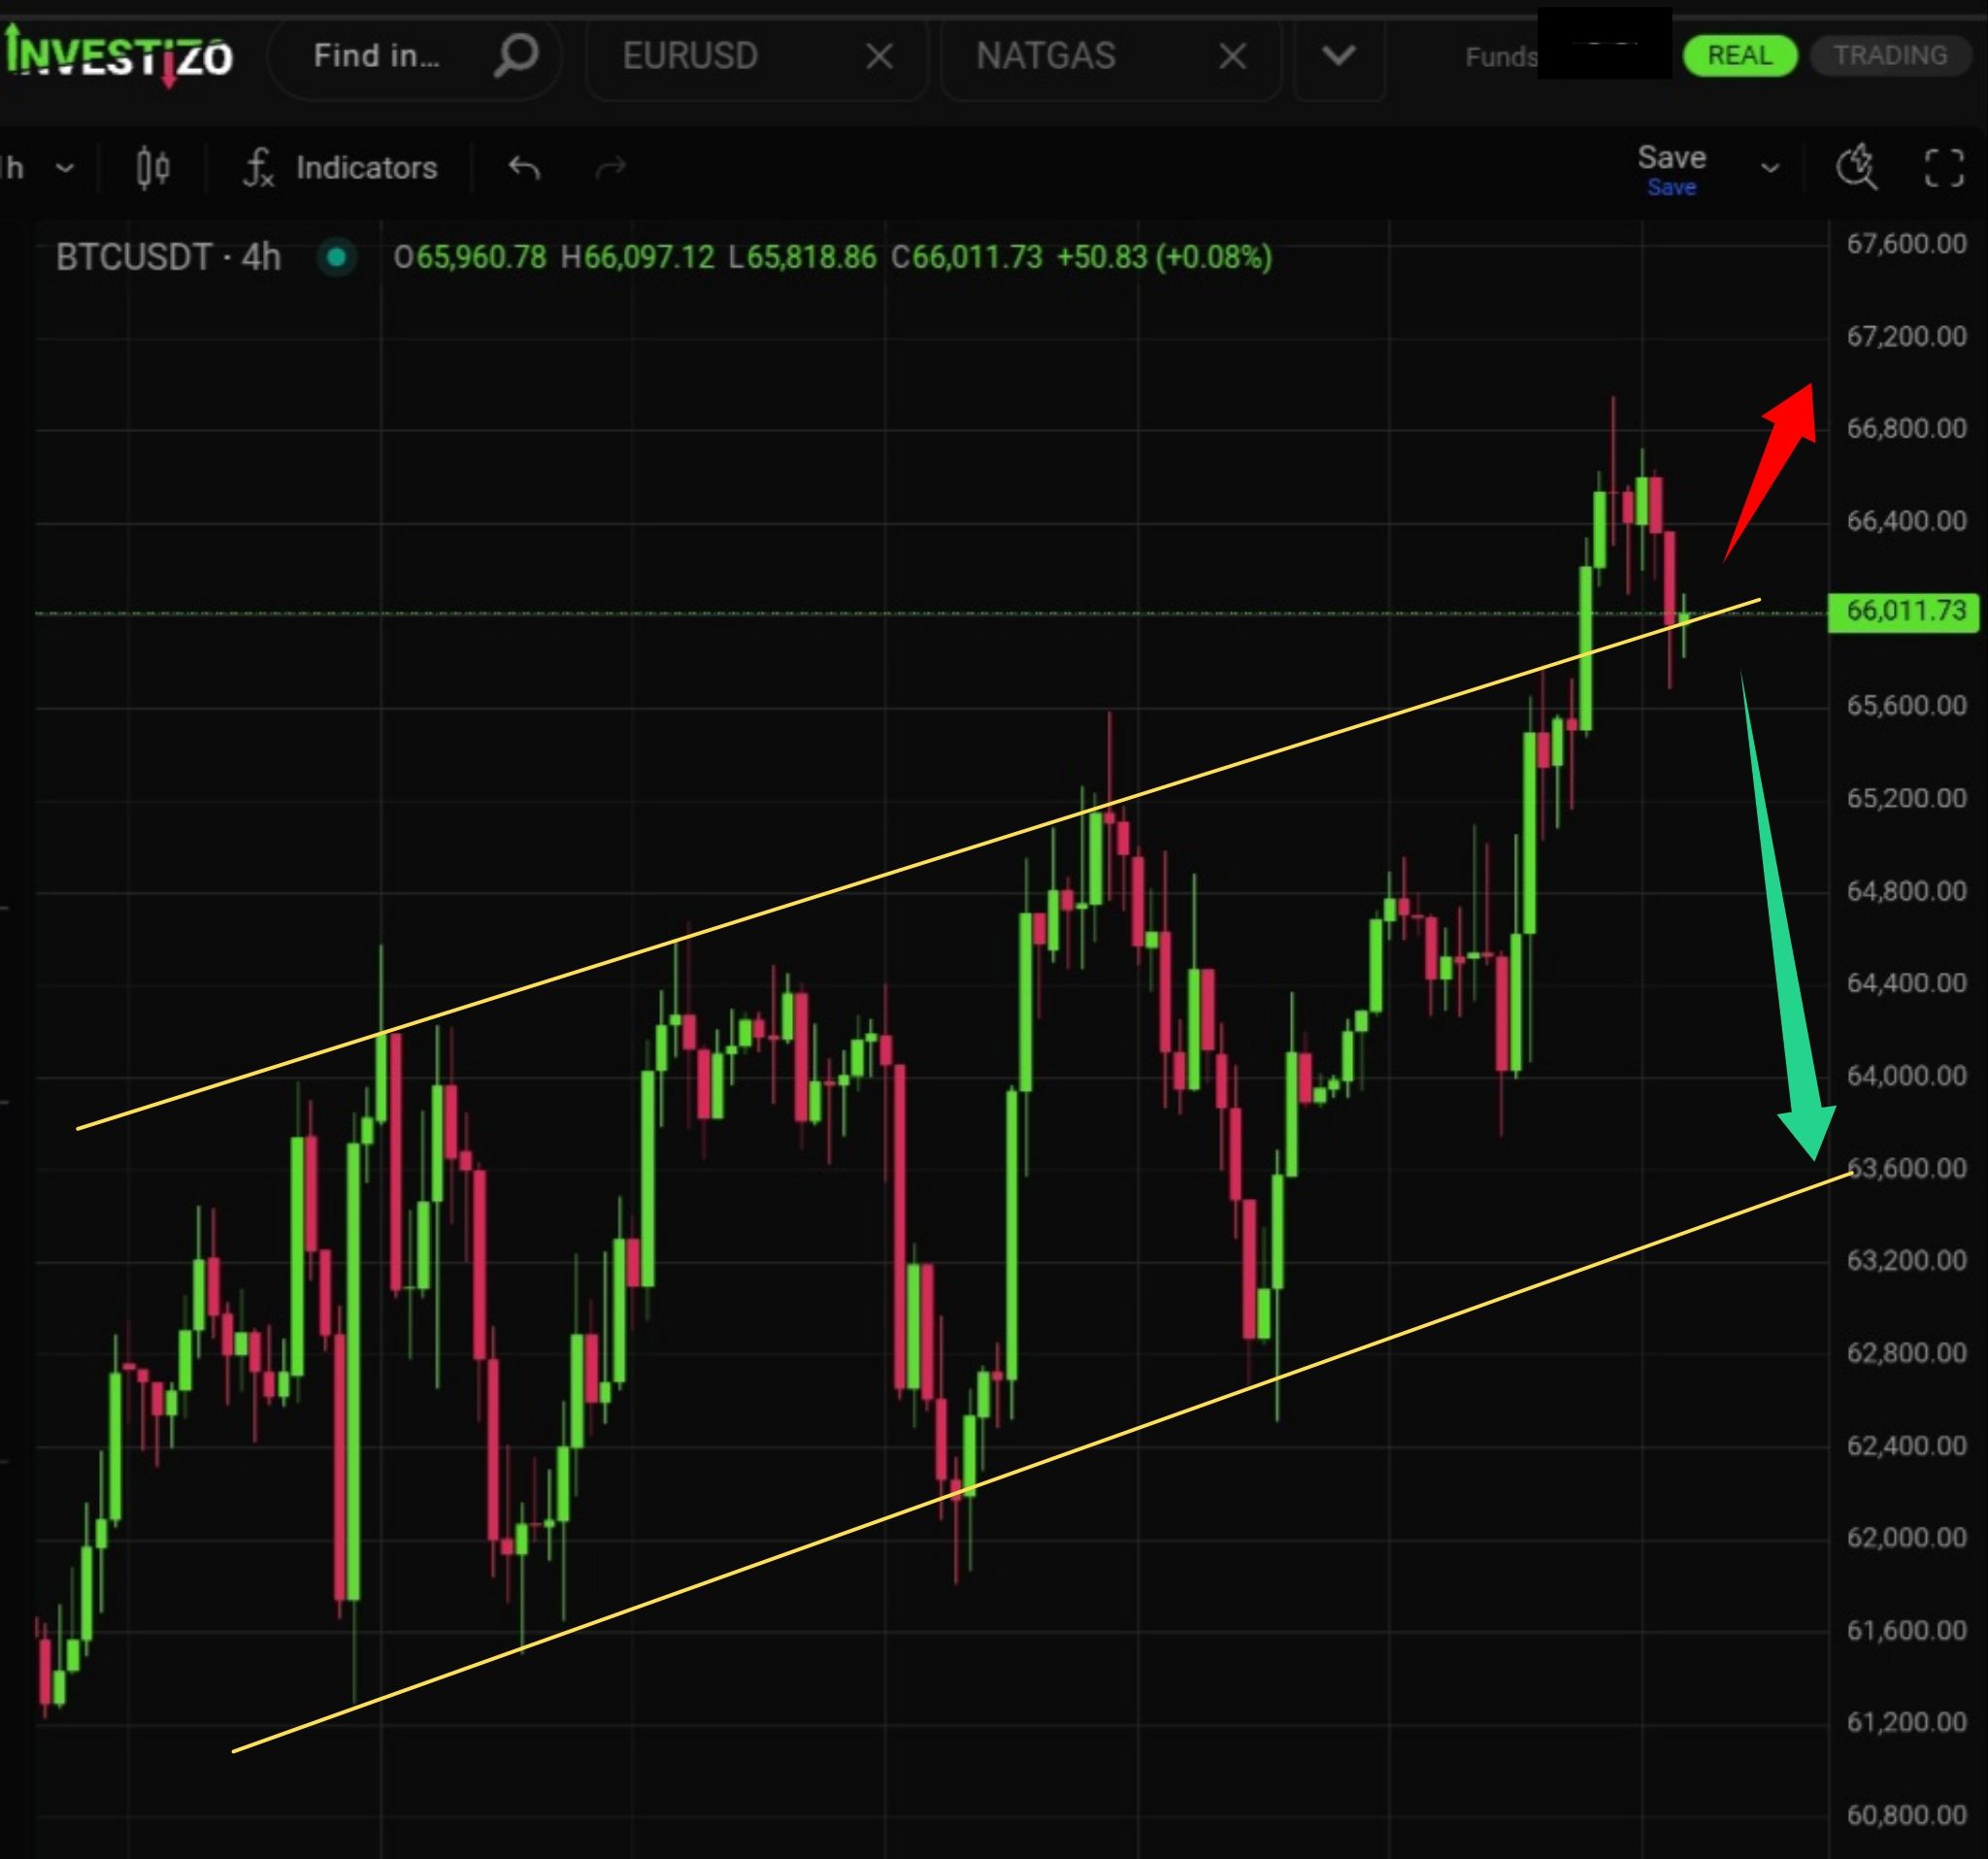
The market is debating whether the breakout above the ascending channel signals a full shift toward buyer dominance or if it was merely a false breakout.
Investizo LTD. Business company number 25432 BC 2019
Suite 305, Griffith Corporate Centre,
P.O. Box 1510, Beachmont, Kingstown,
St. Vincent and the Grenadines
DUNS 817053497
Phone:+996312610515
E-mail: [email protected]
© 2019-2026 Investizo 18+ All rights reserved
Risk Warning: CFDs are complex financial products traded on margin. Trading CFDs is risky and may not be suitable for all investors. Ensure you understand the risks involved as you may lose all your invested capital.
The market is debating whether the breakout above the ascending channel signals a full shift toward buyer dominance or if it was merely a false breakout.
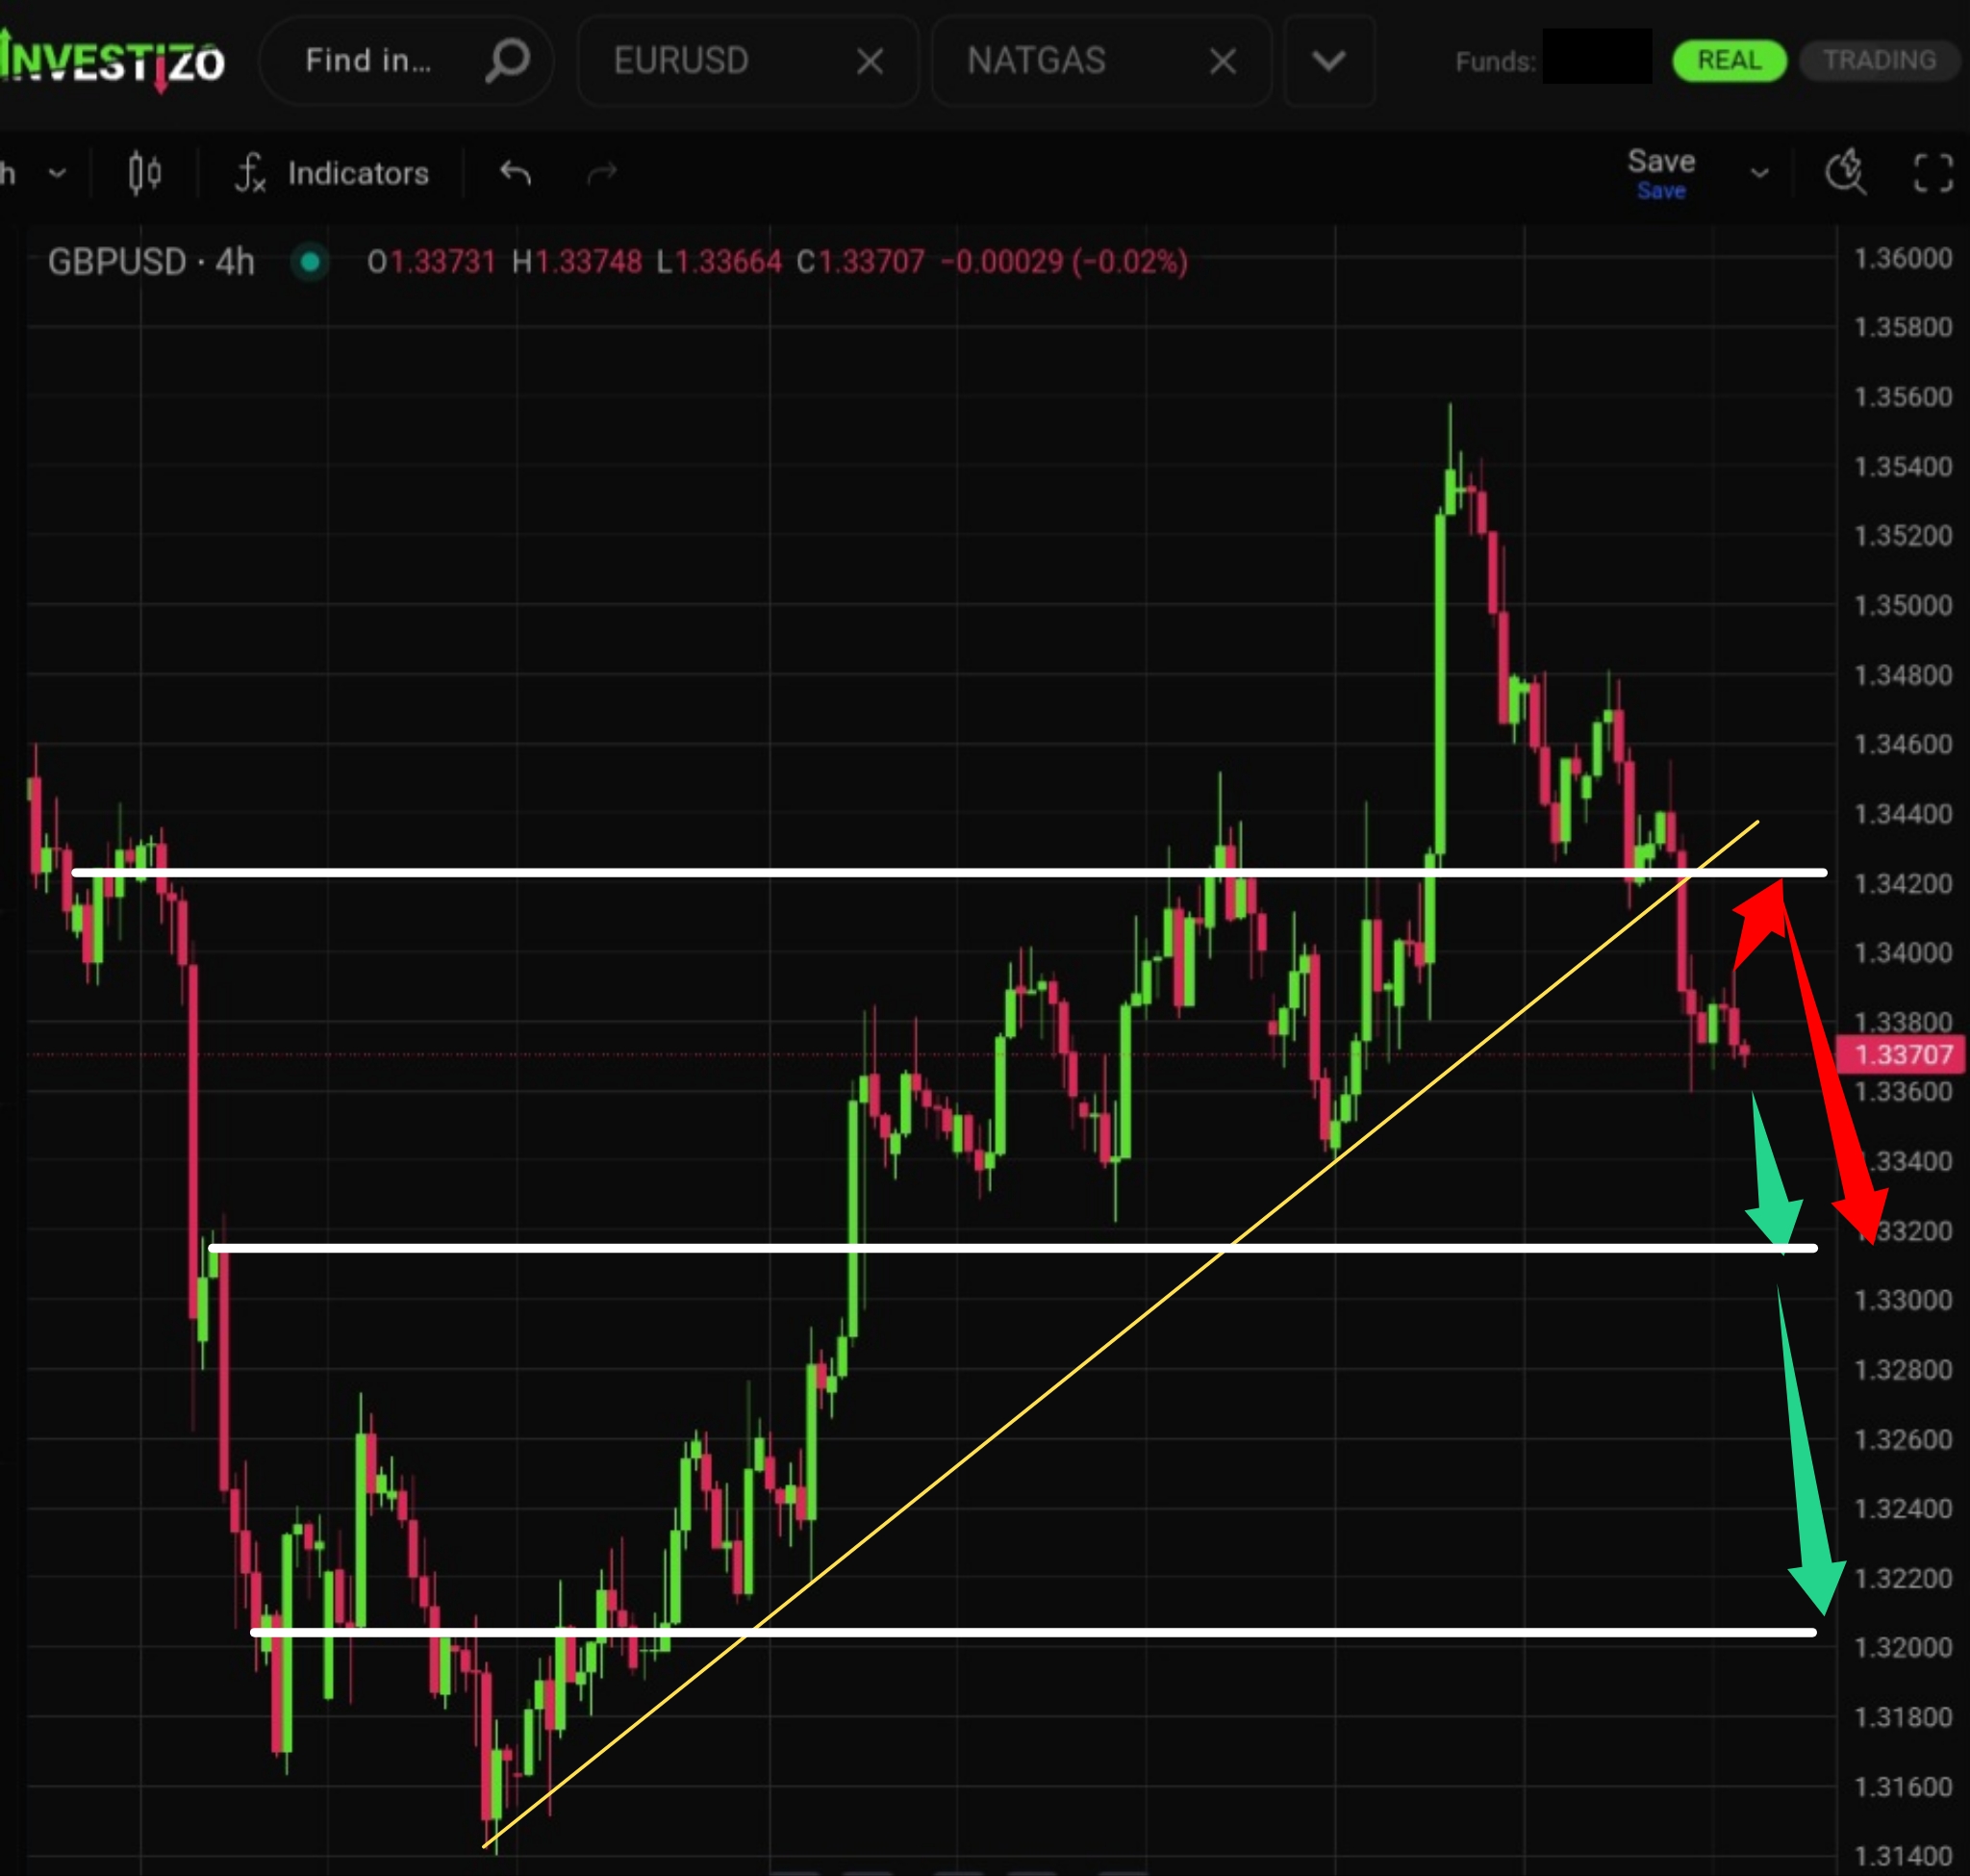
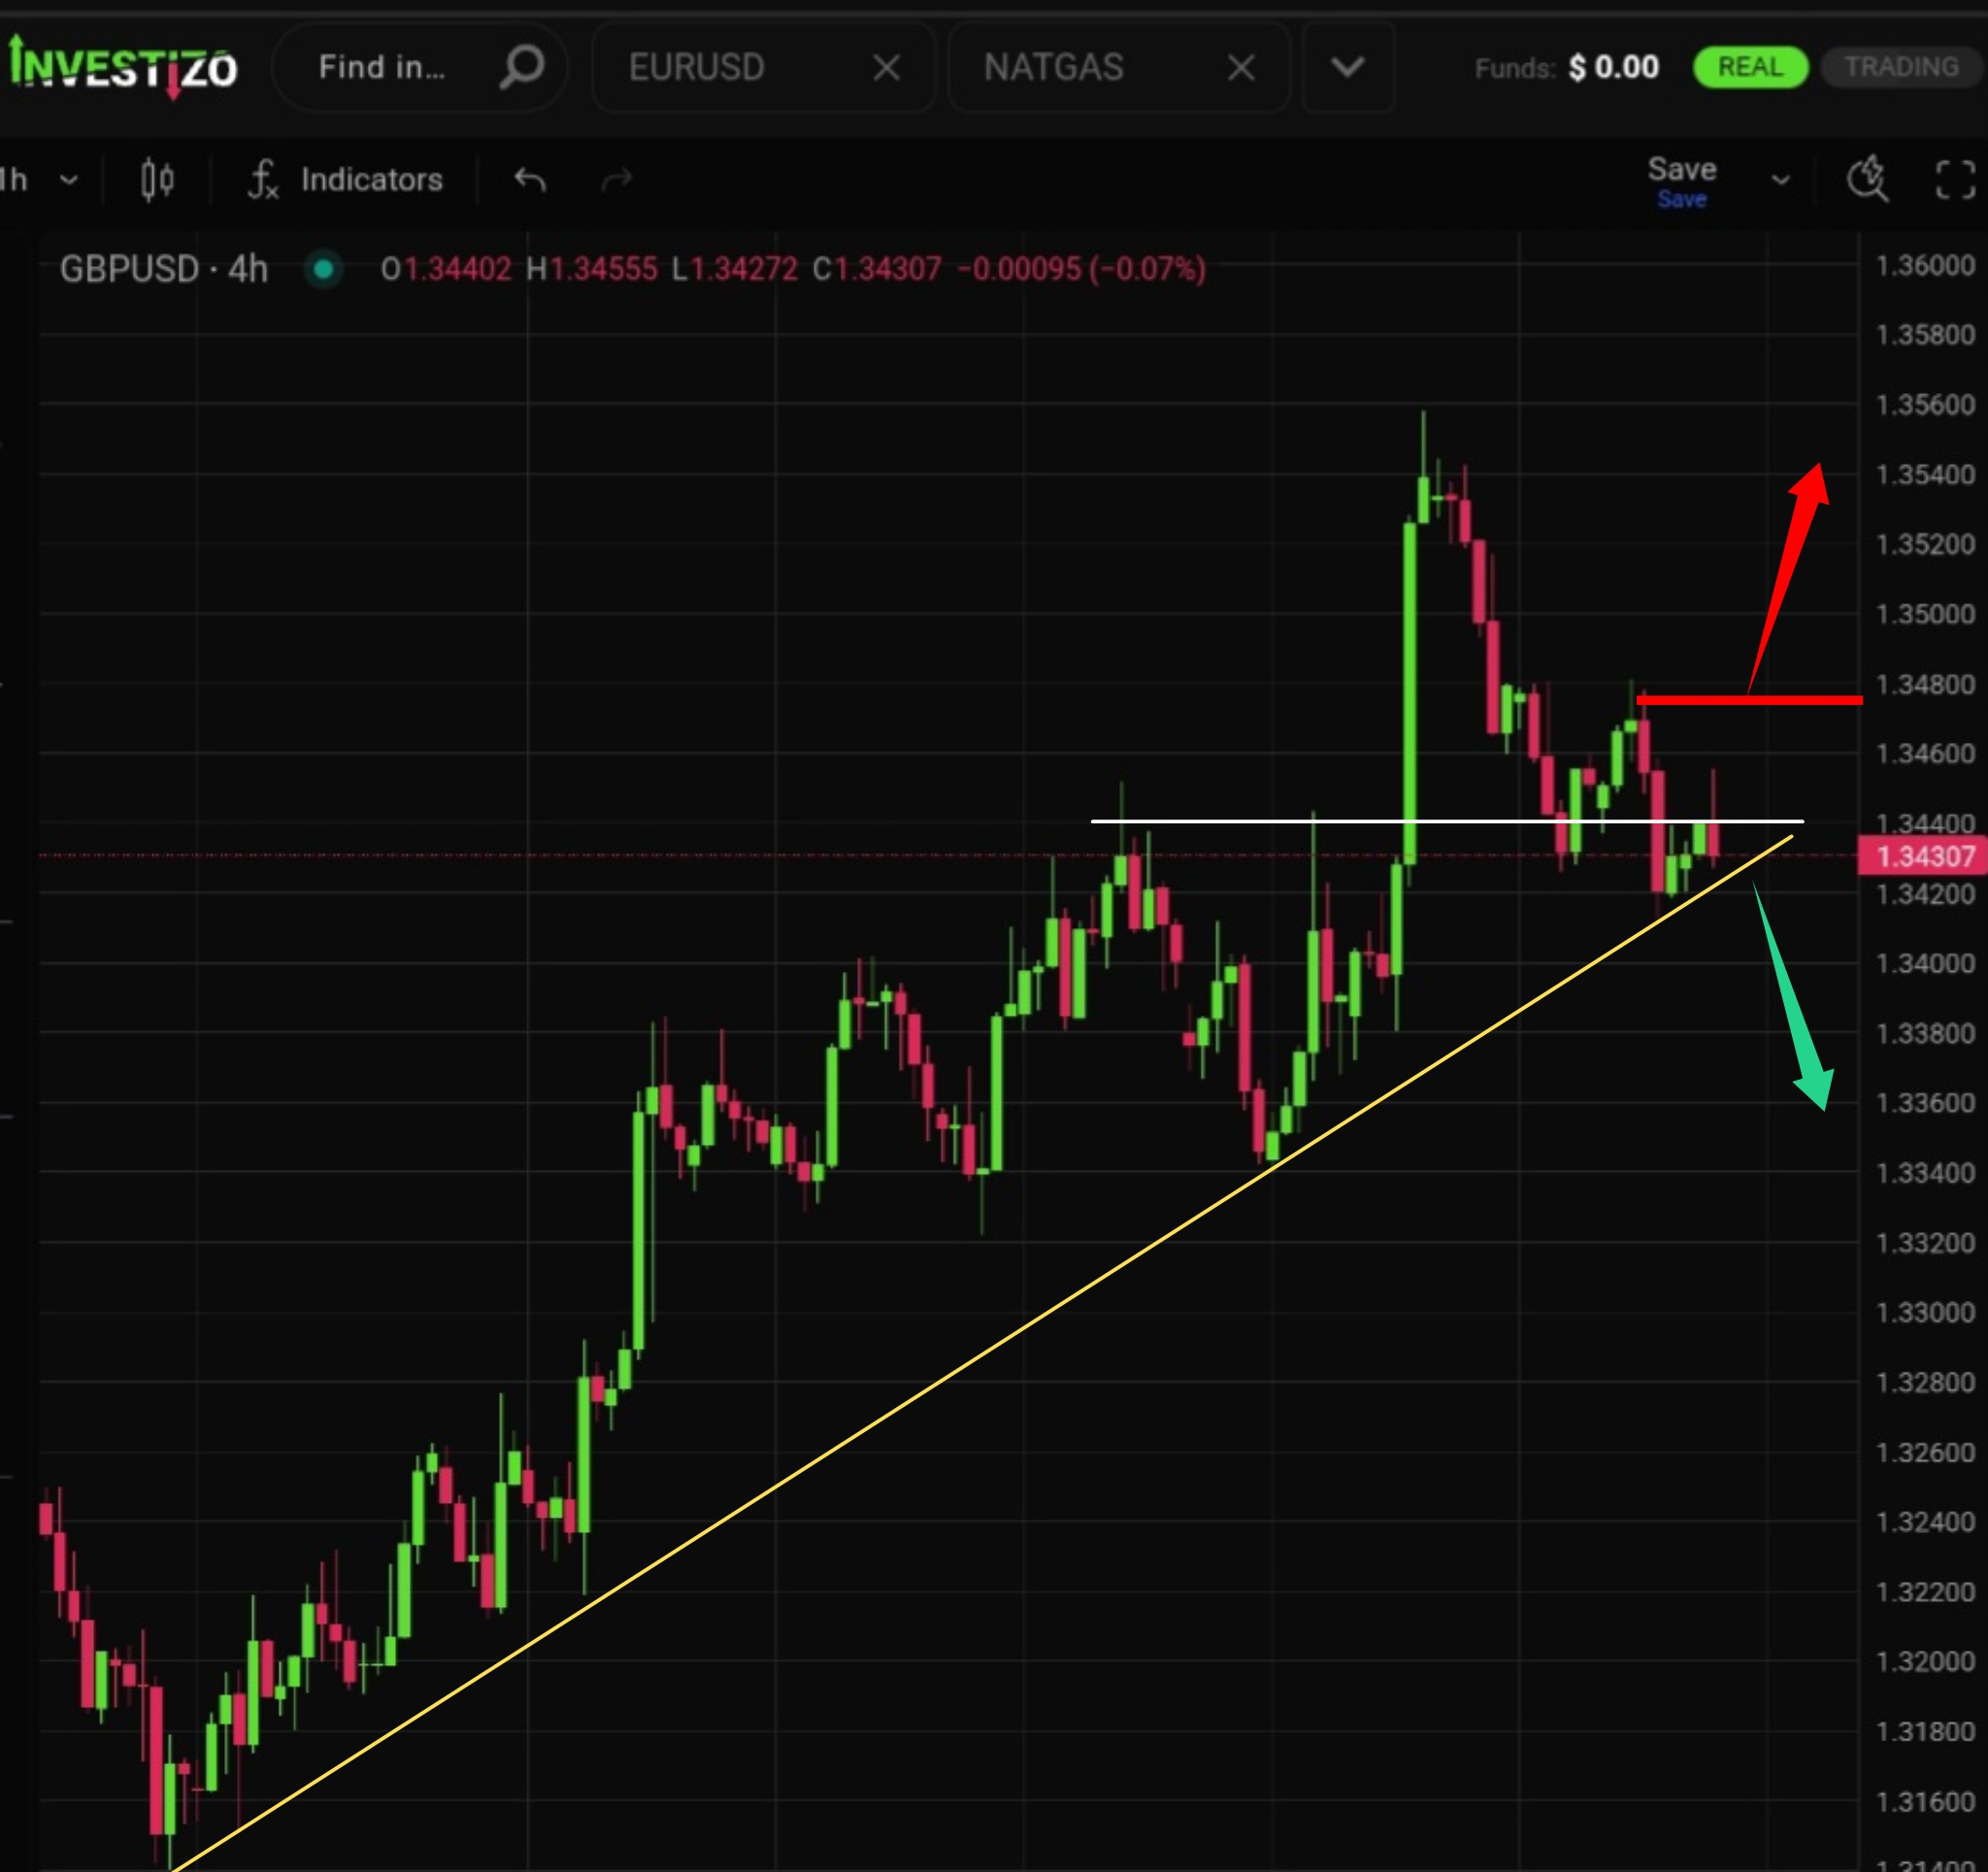
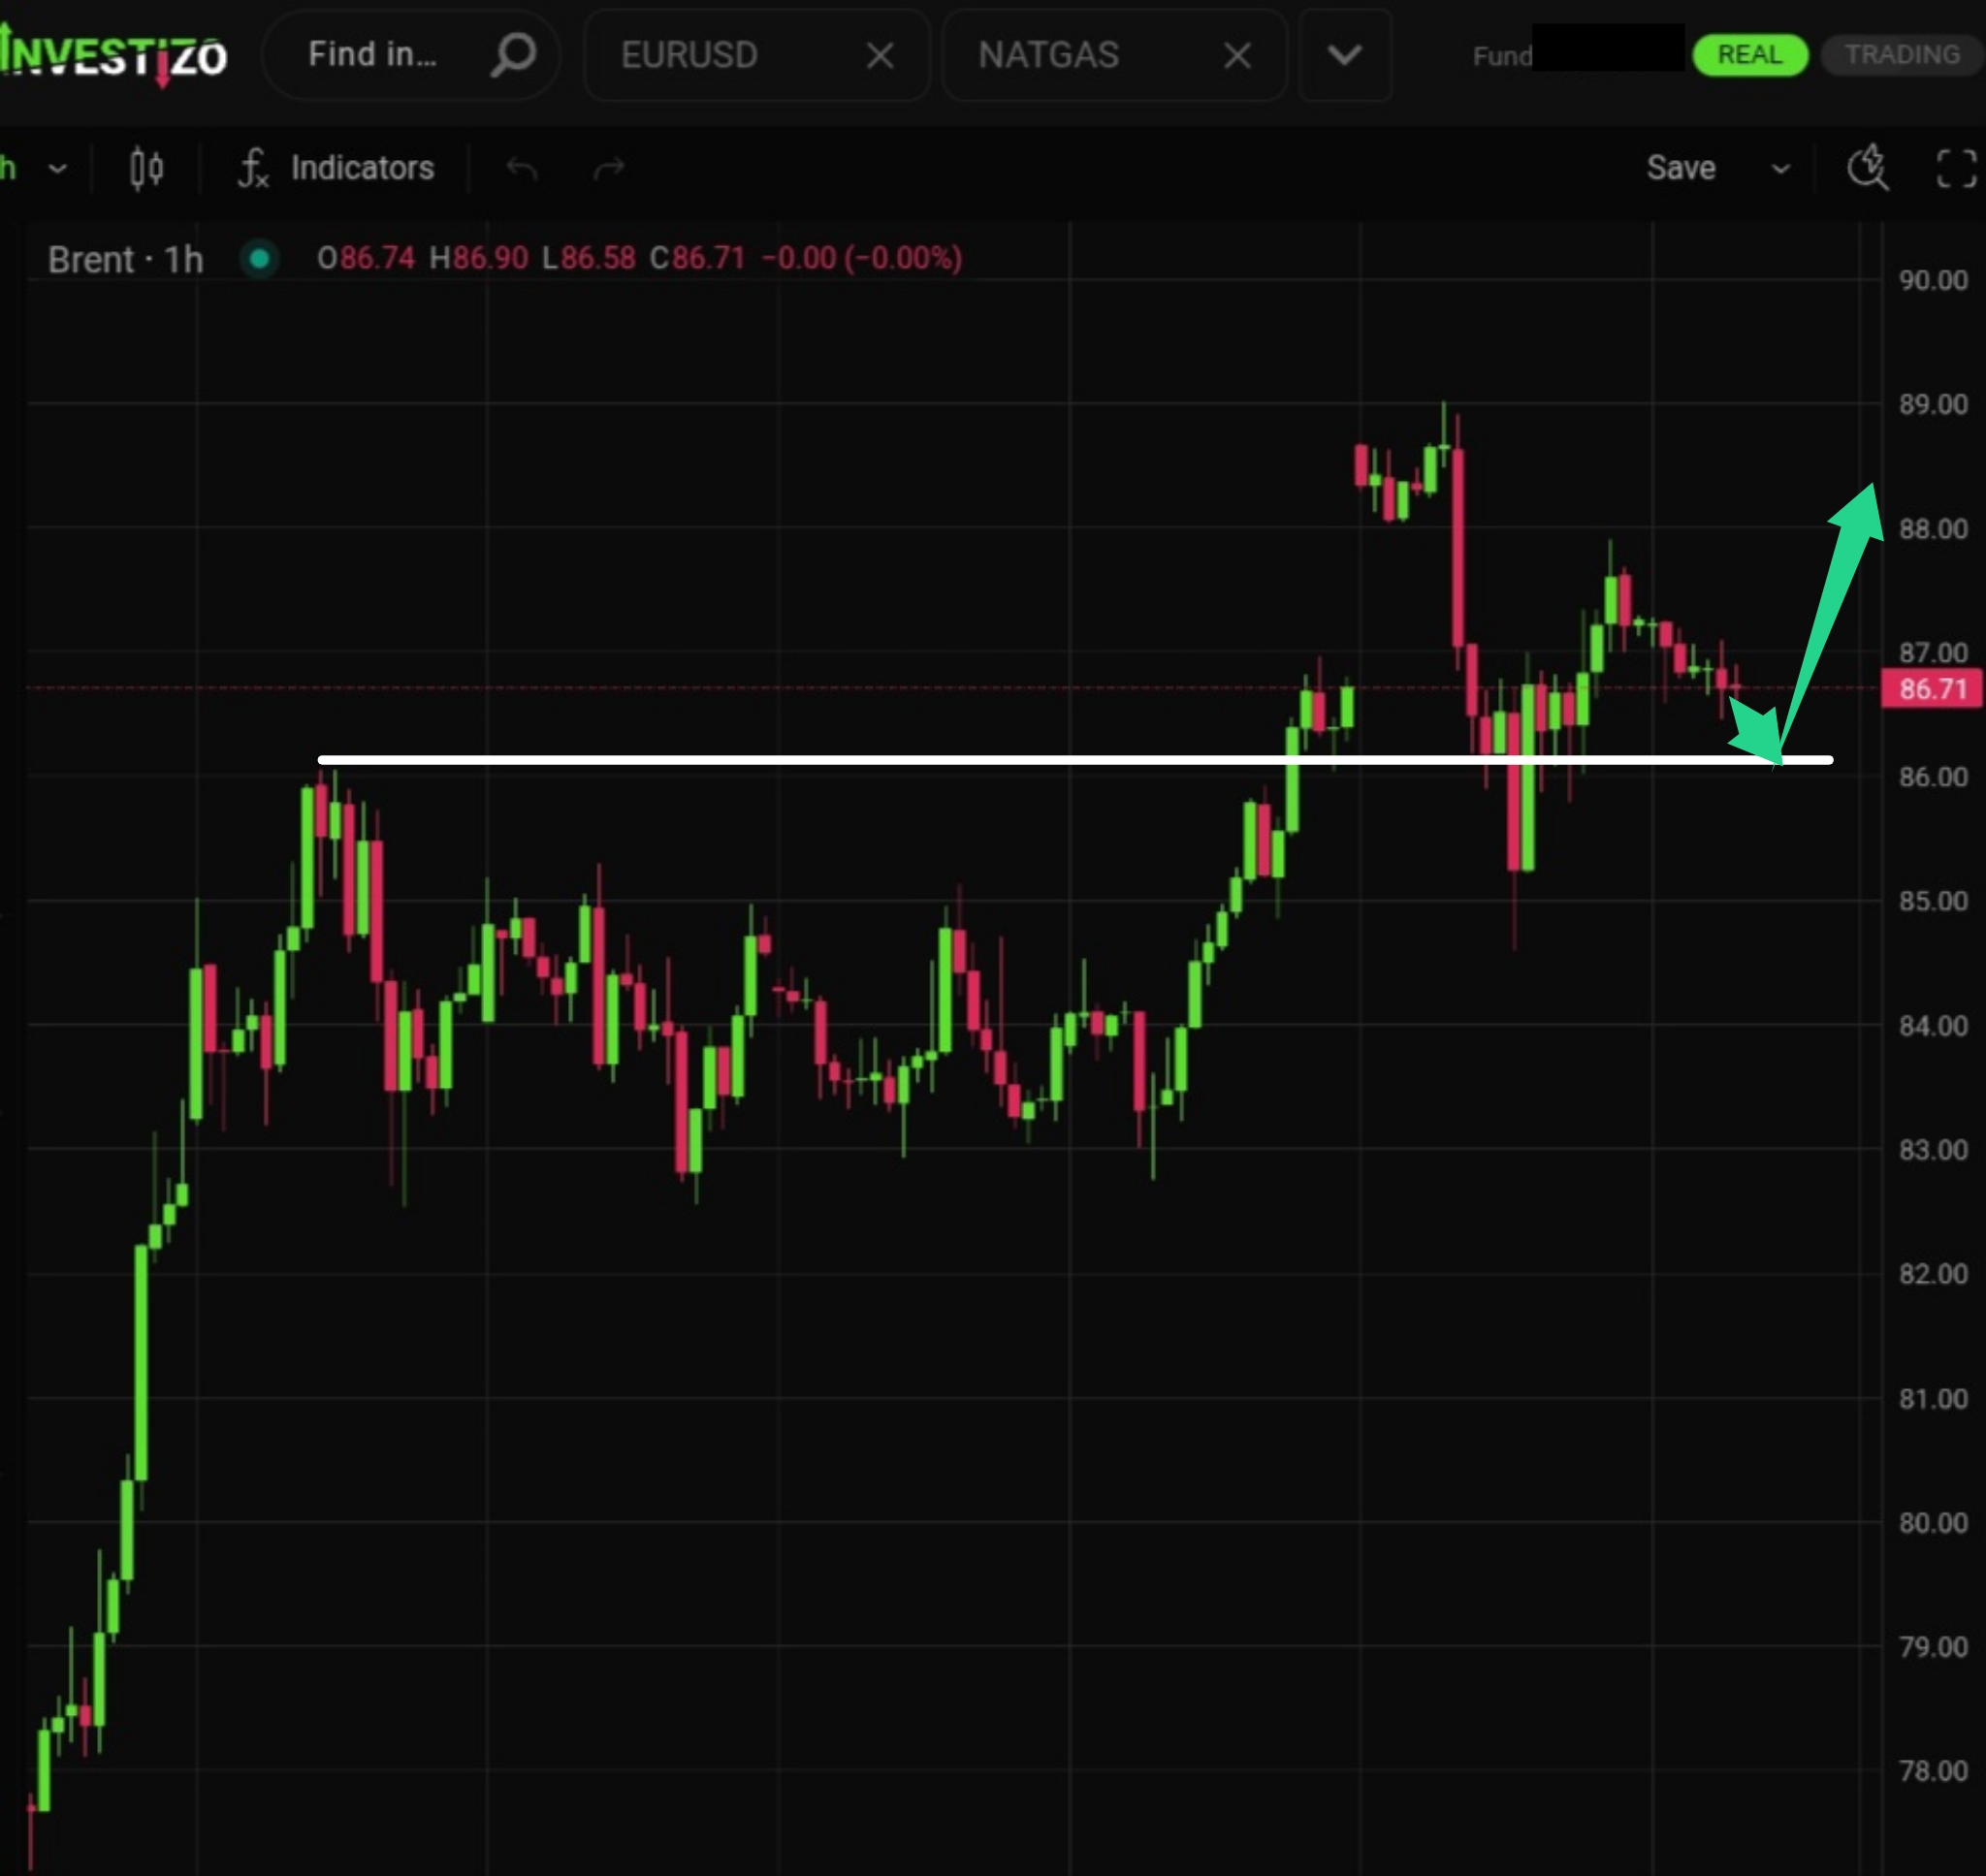
The local uptrend that followed the breakout of the trendline appears to have completed.
The strong upward momentum triggered active profit-taking, resulting in a sharp local sell-off of nearly 70 pips.
The final phase of consolidation is underway ahead of a highly probable breakdown of the downward-sloping trendline.
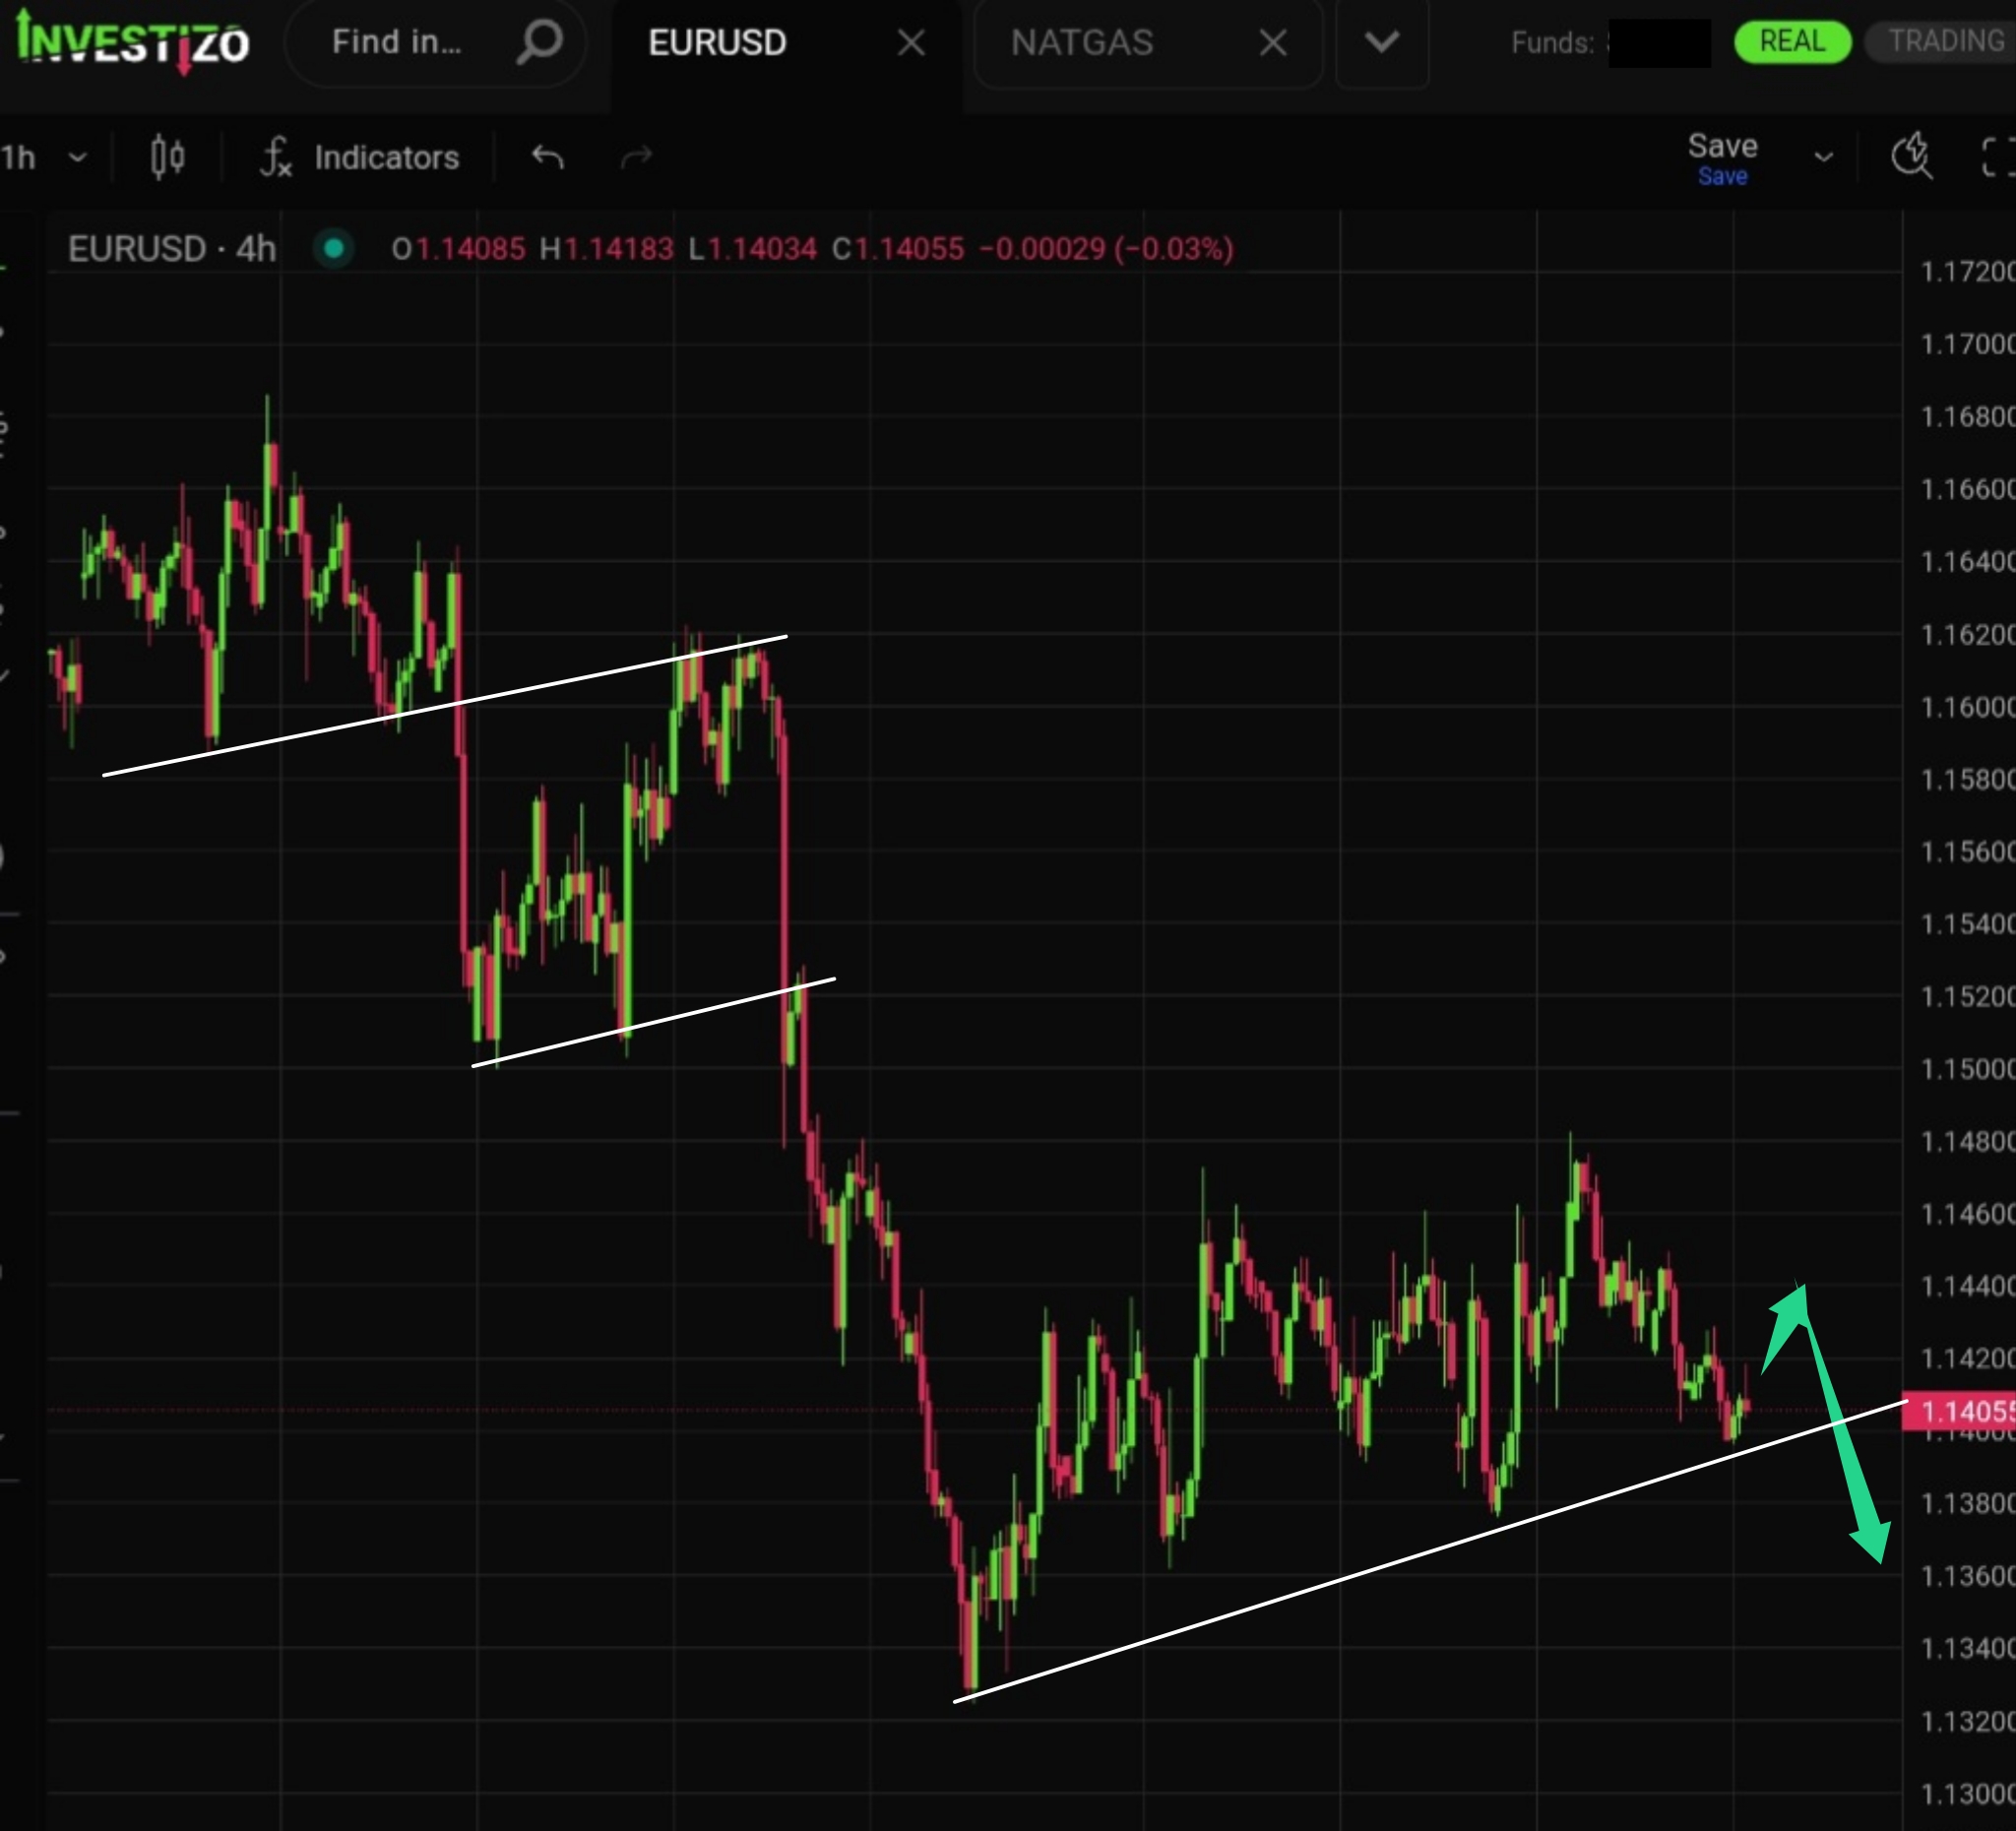
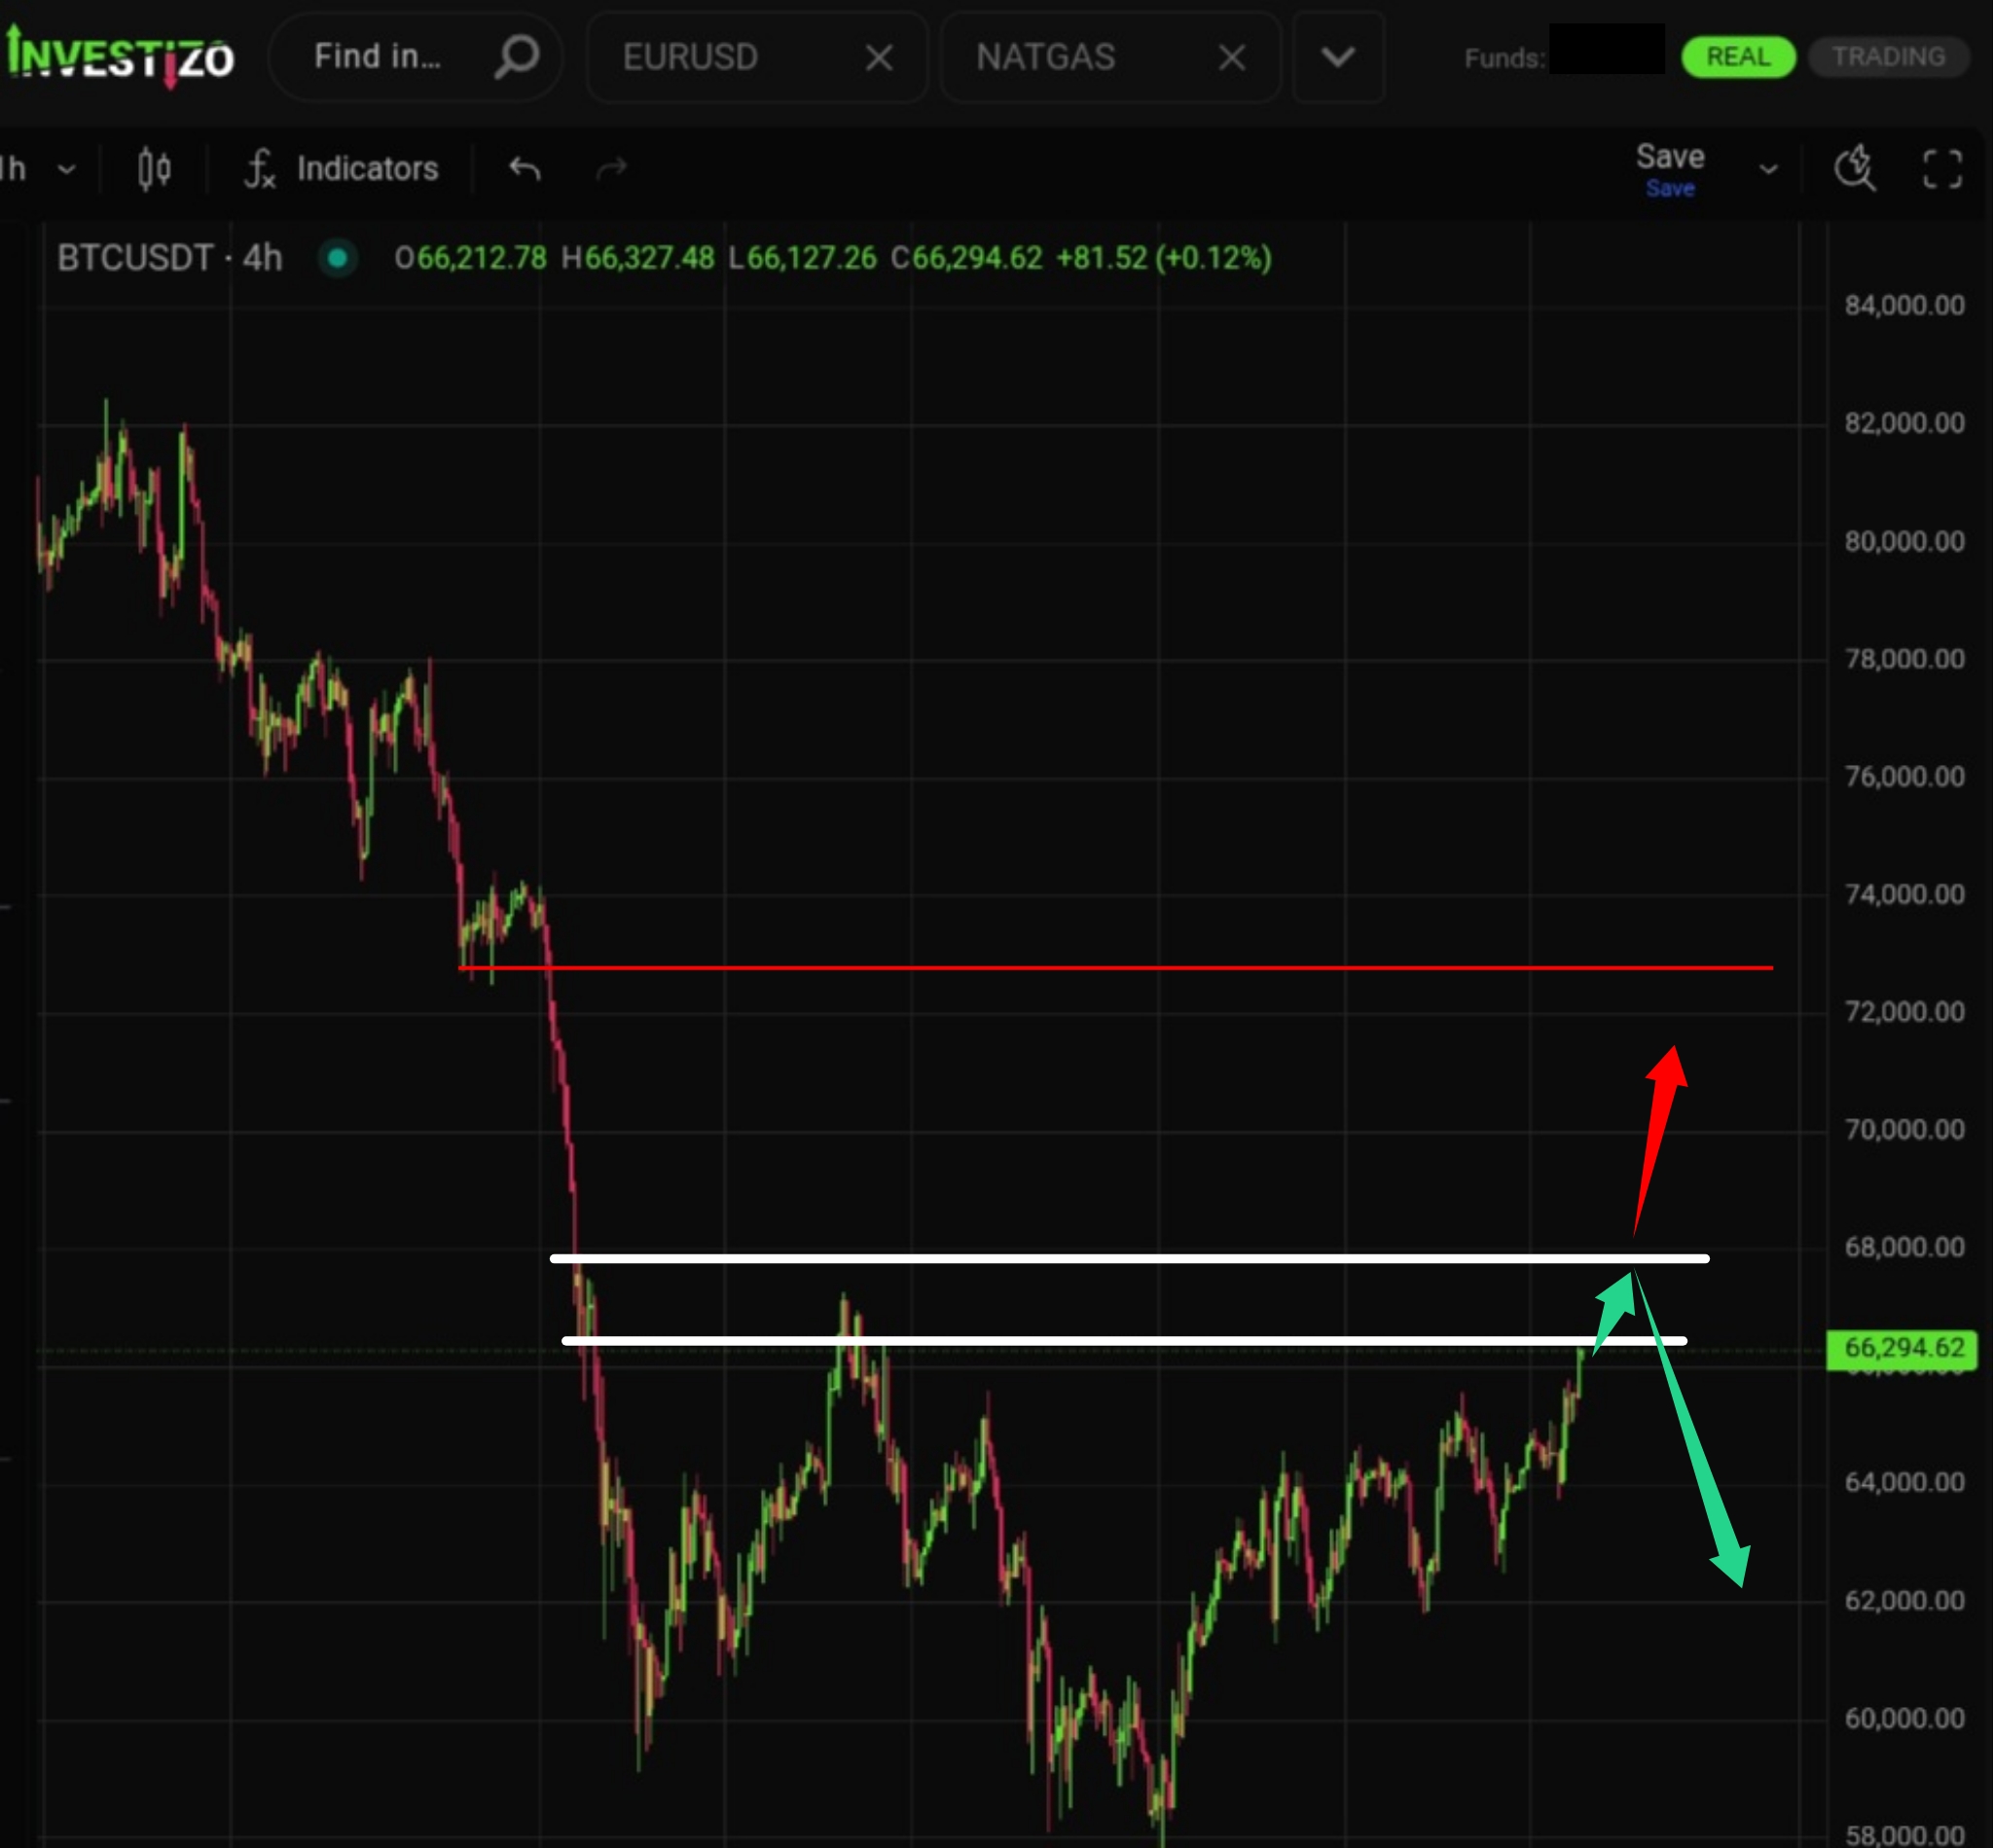
The medium-term downtrend line has been decisively broken, allowing bulls to establish a solid base for a potential upward move over the coming weeks.
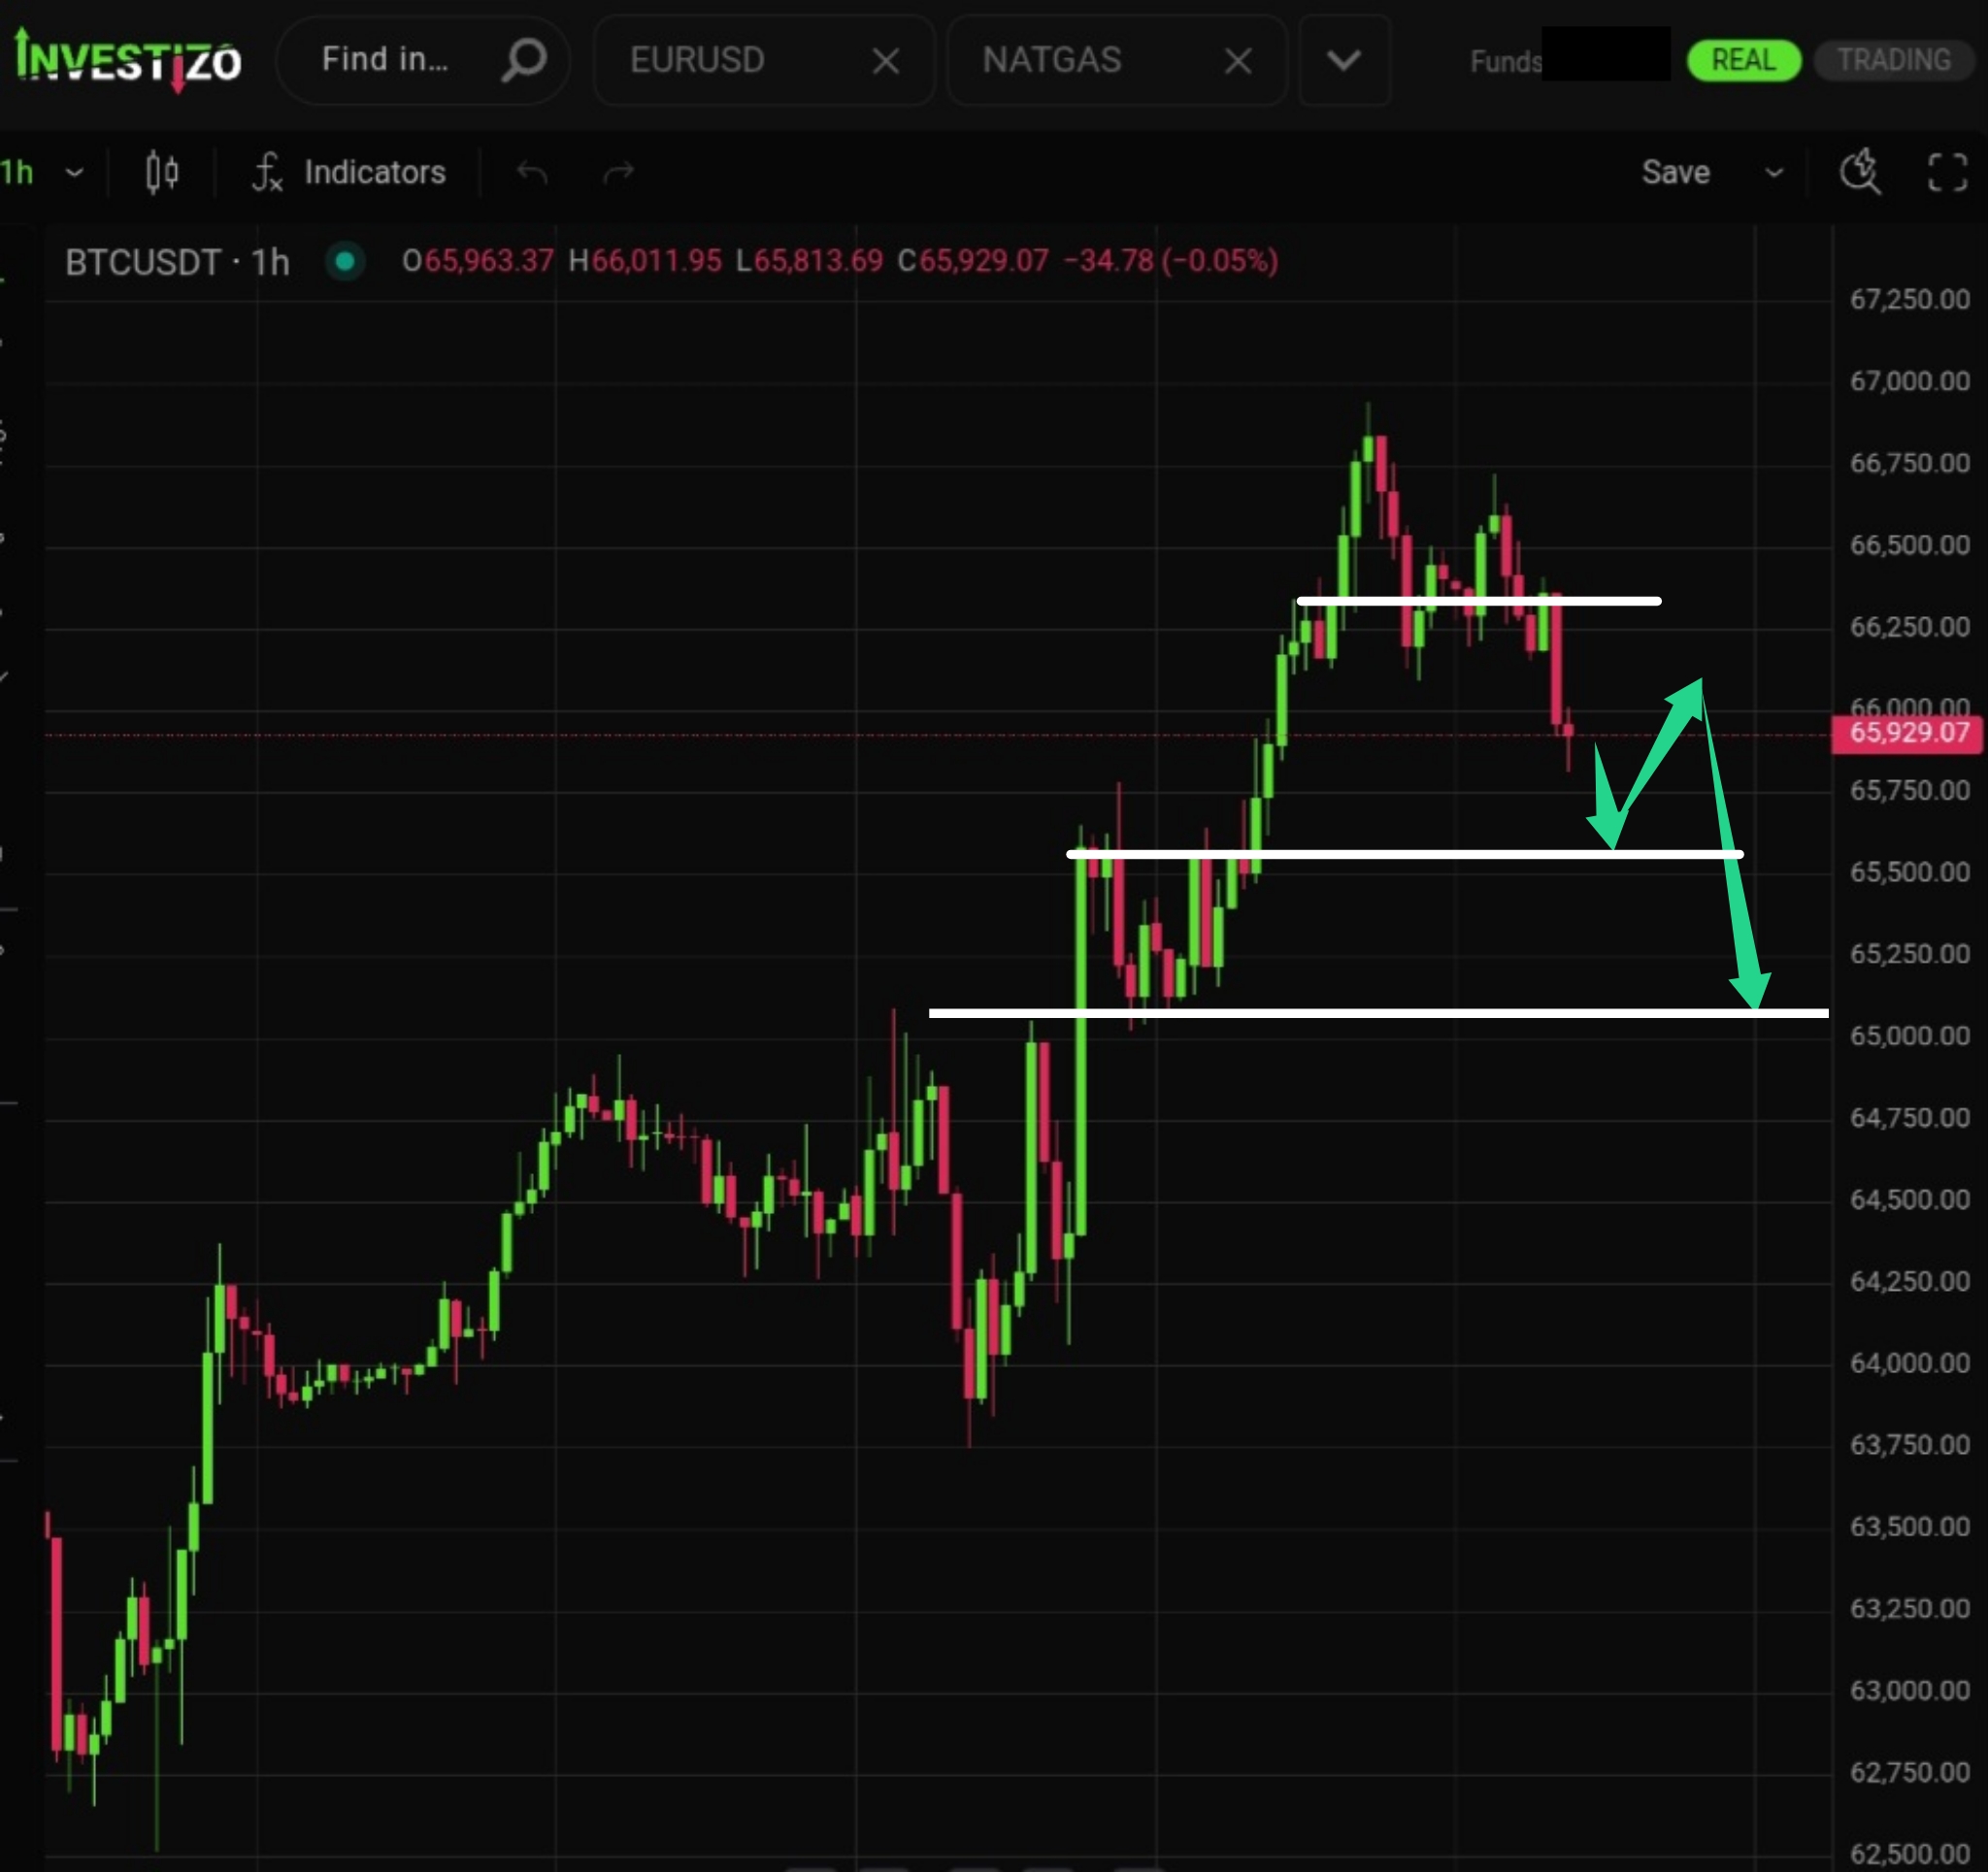
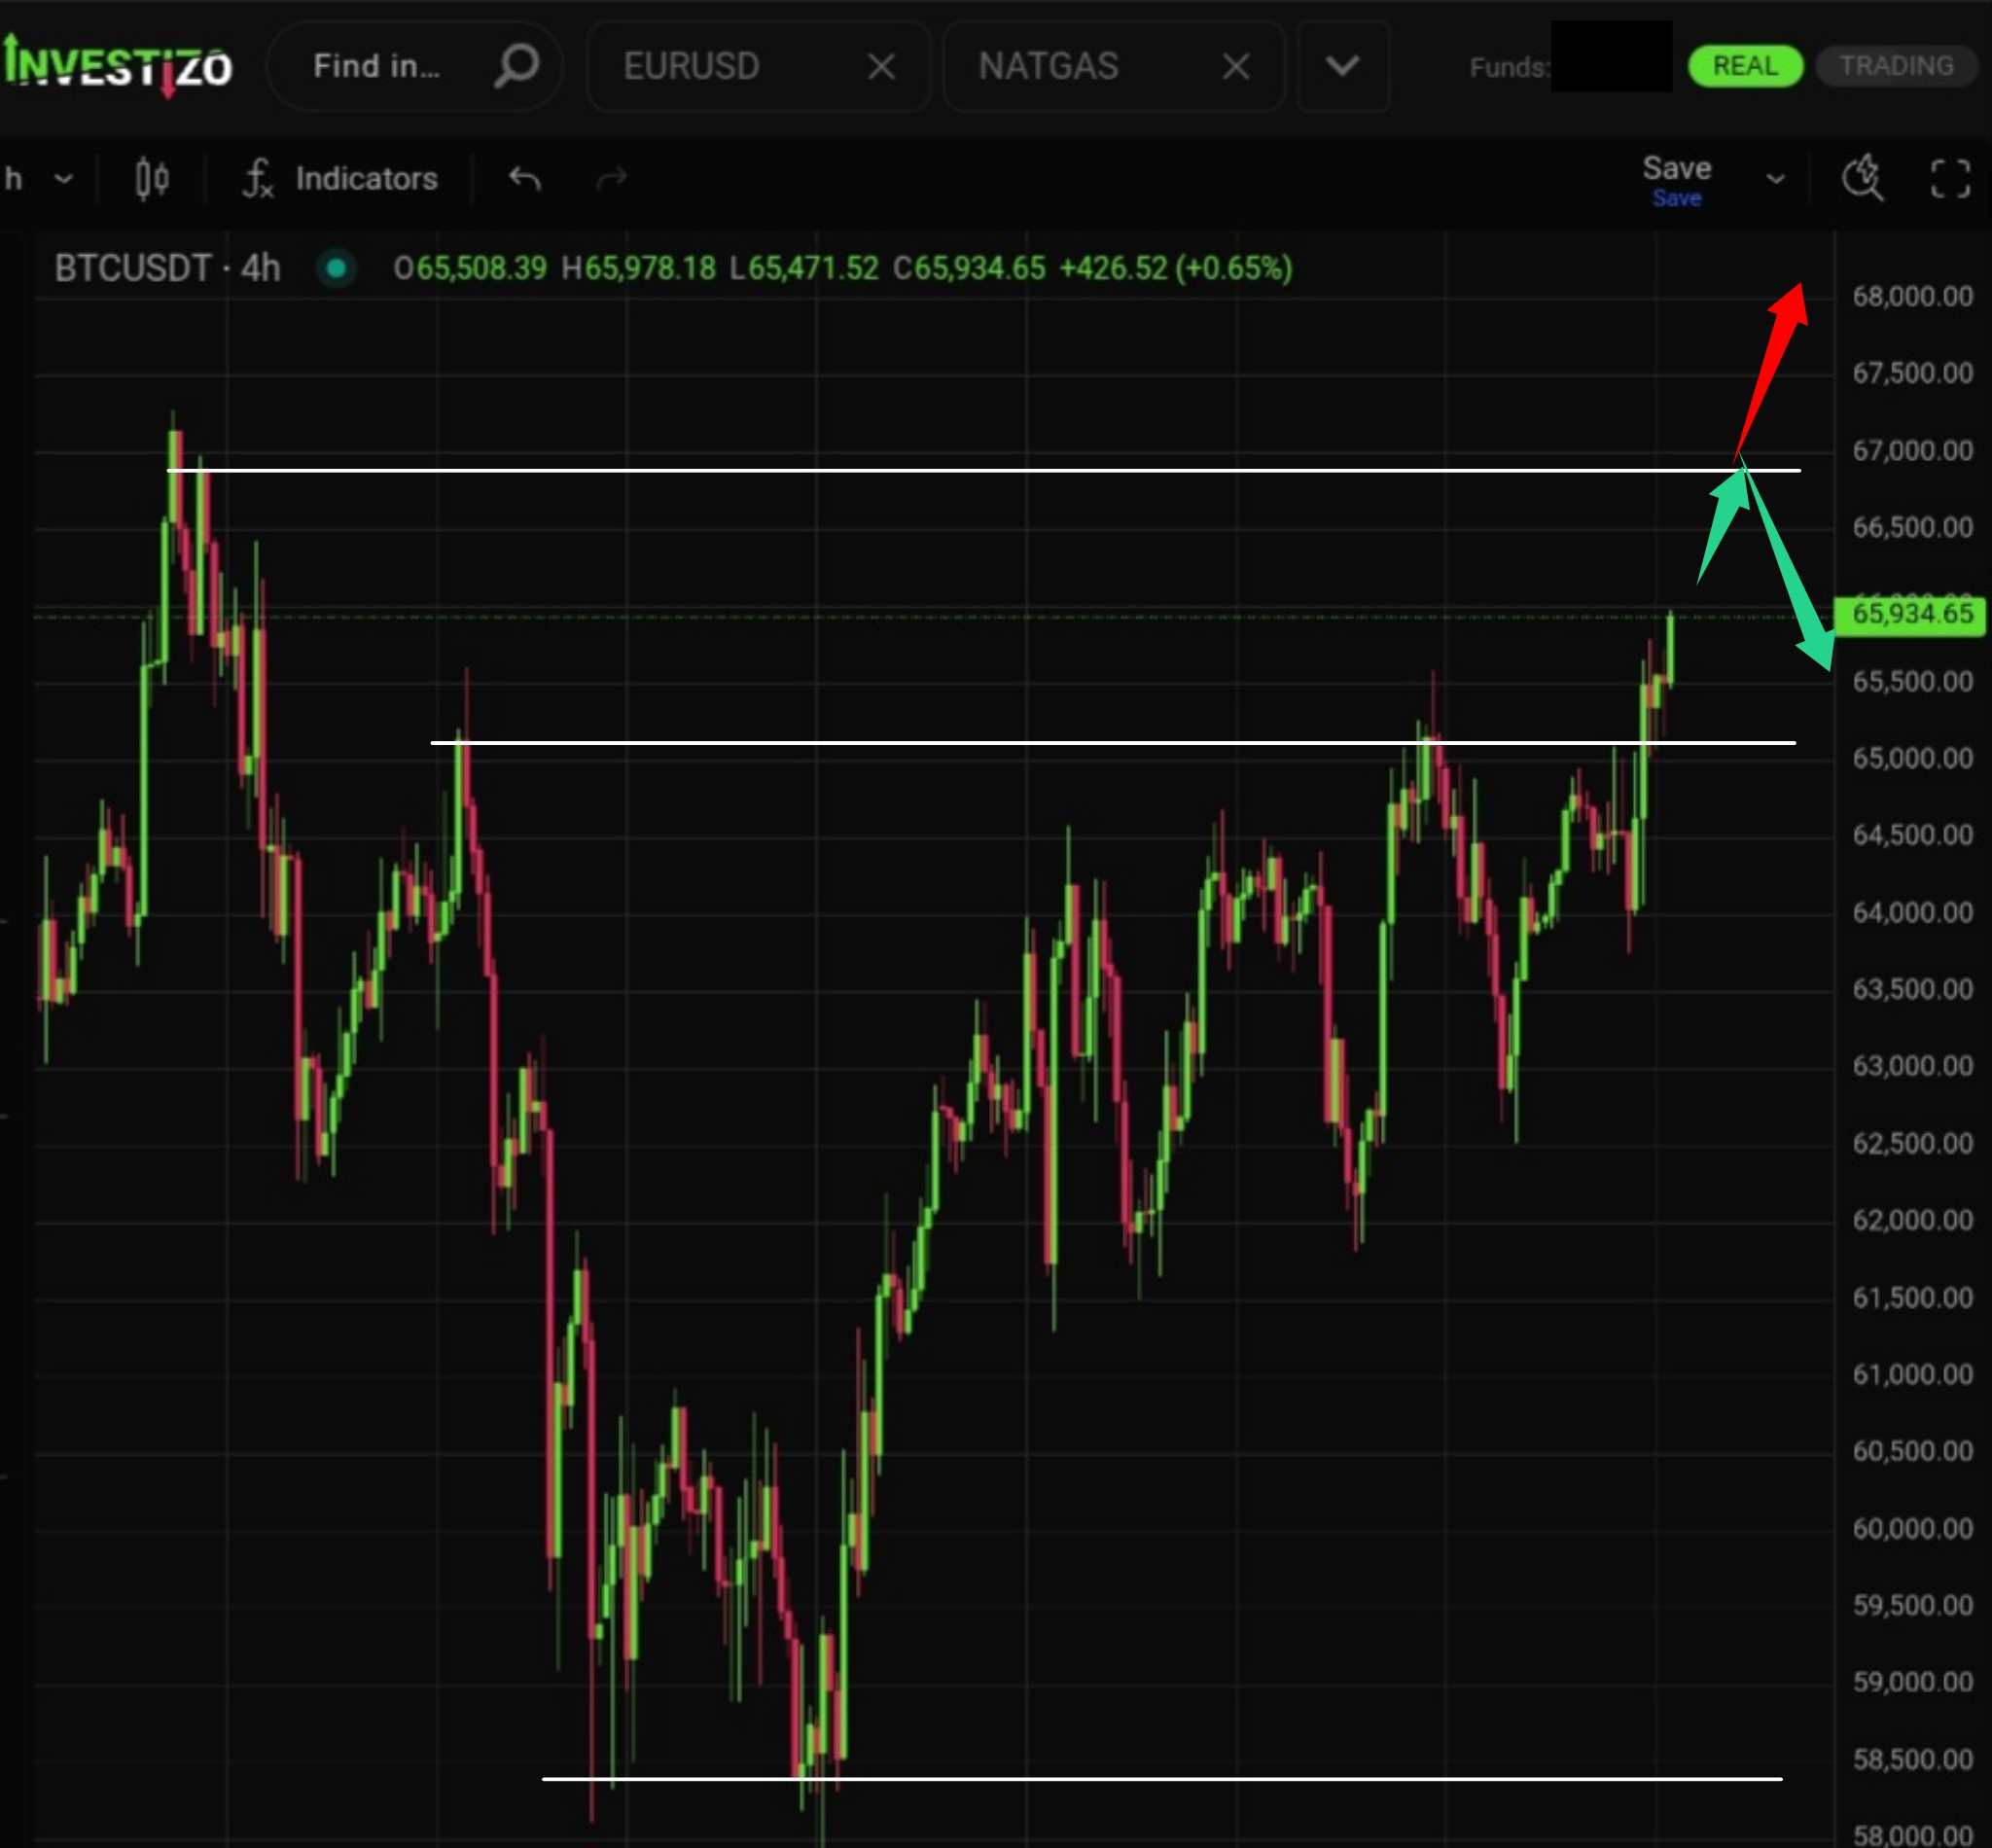
Bitcoin (BTC/USD) trades at 65,930 this Wednesday morning, consolidating near five-week highs along the upper boundary of its established 59,000 to 66,000 trading range.
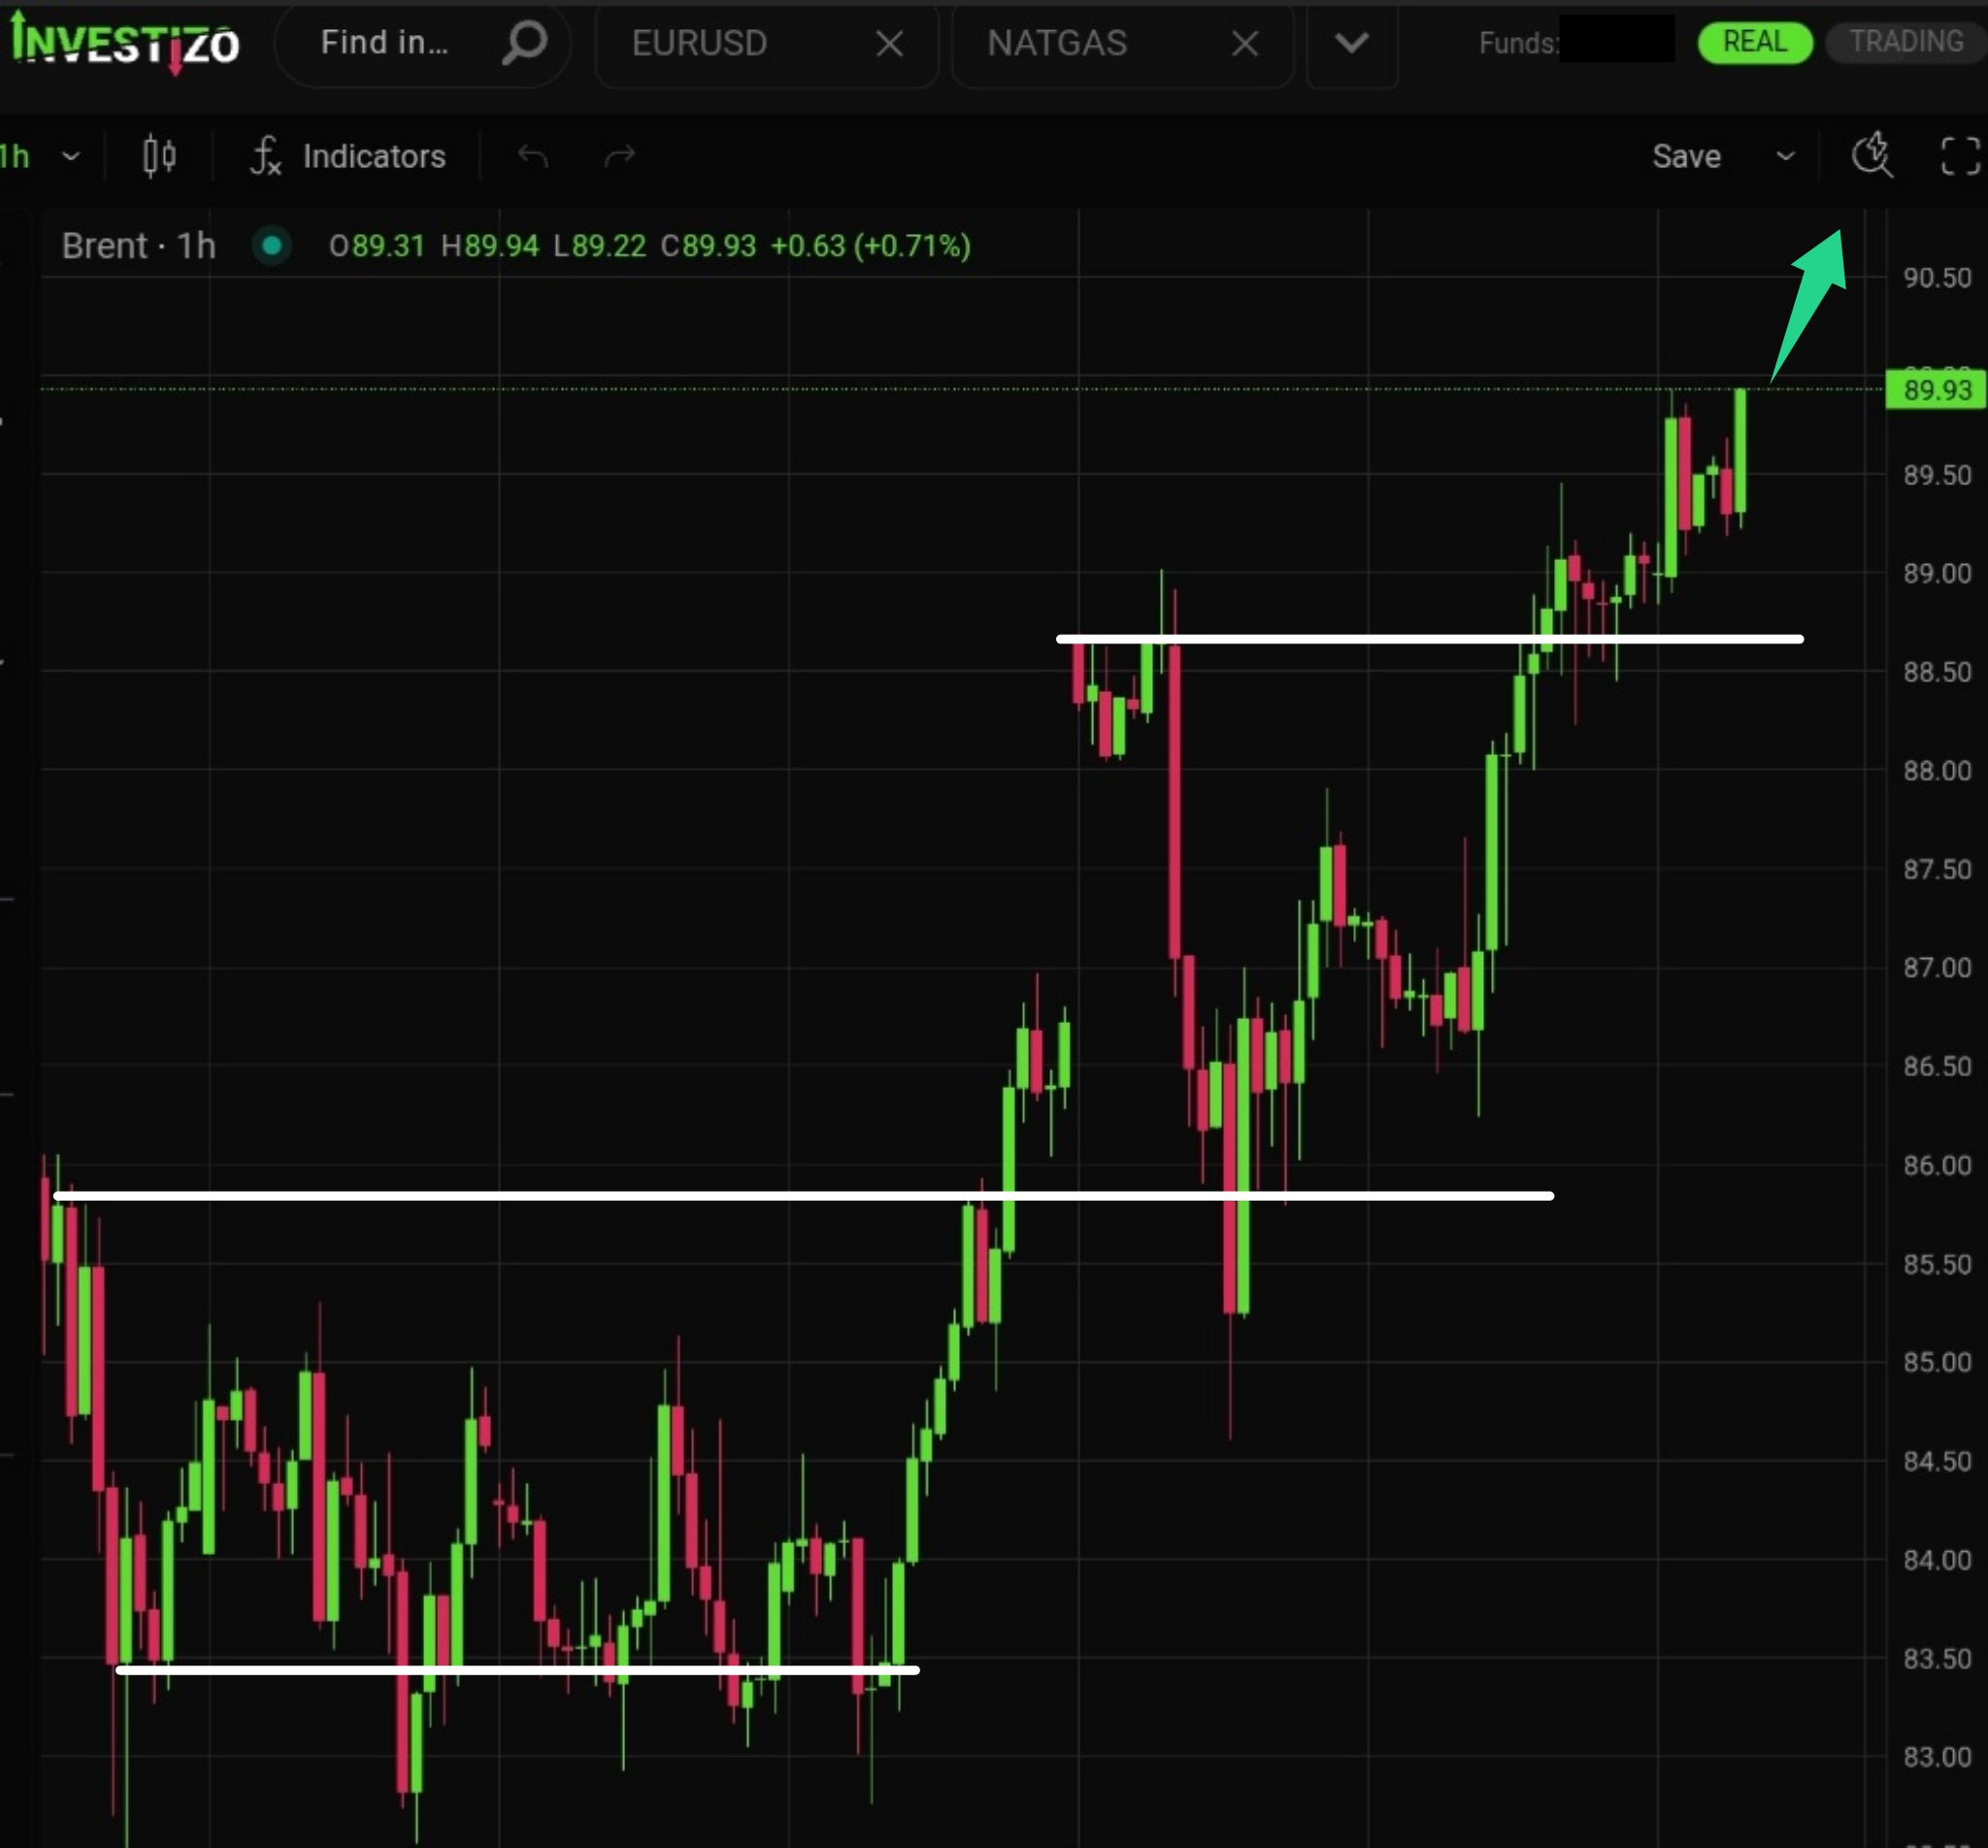
Brent Crude trades at $90.00 this Wednesday morning, reaching the key psychological threshold after mounting a 20% rally across July.
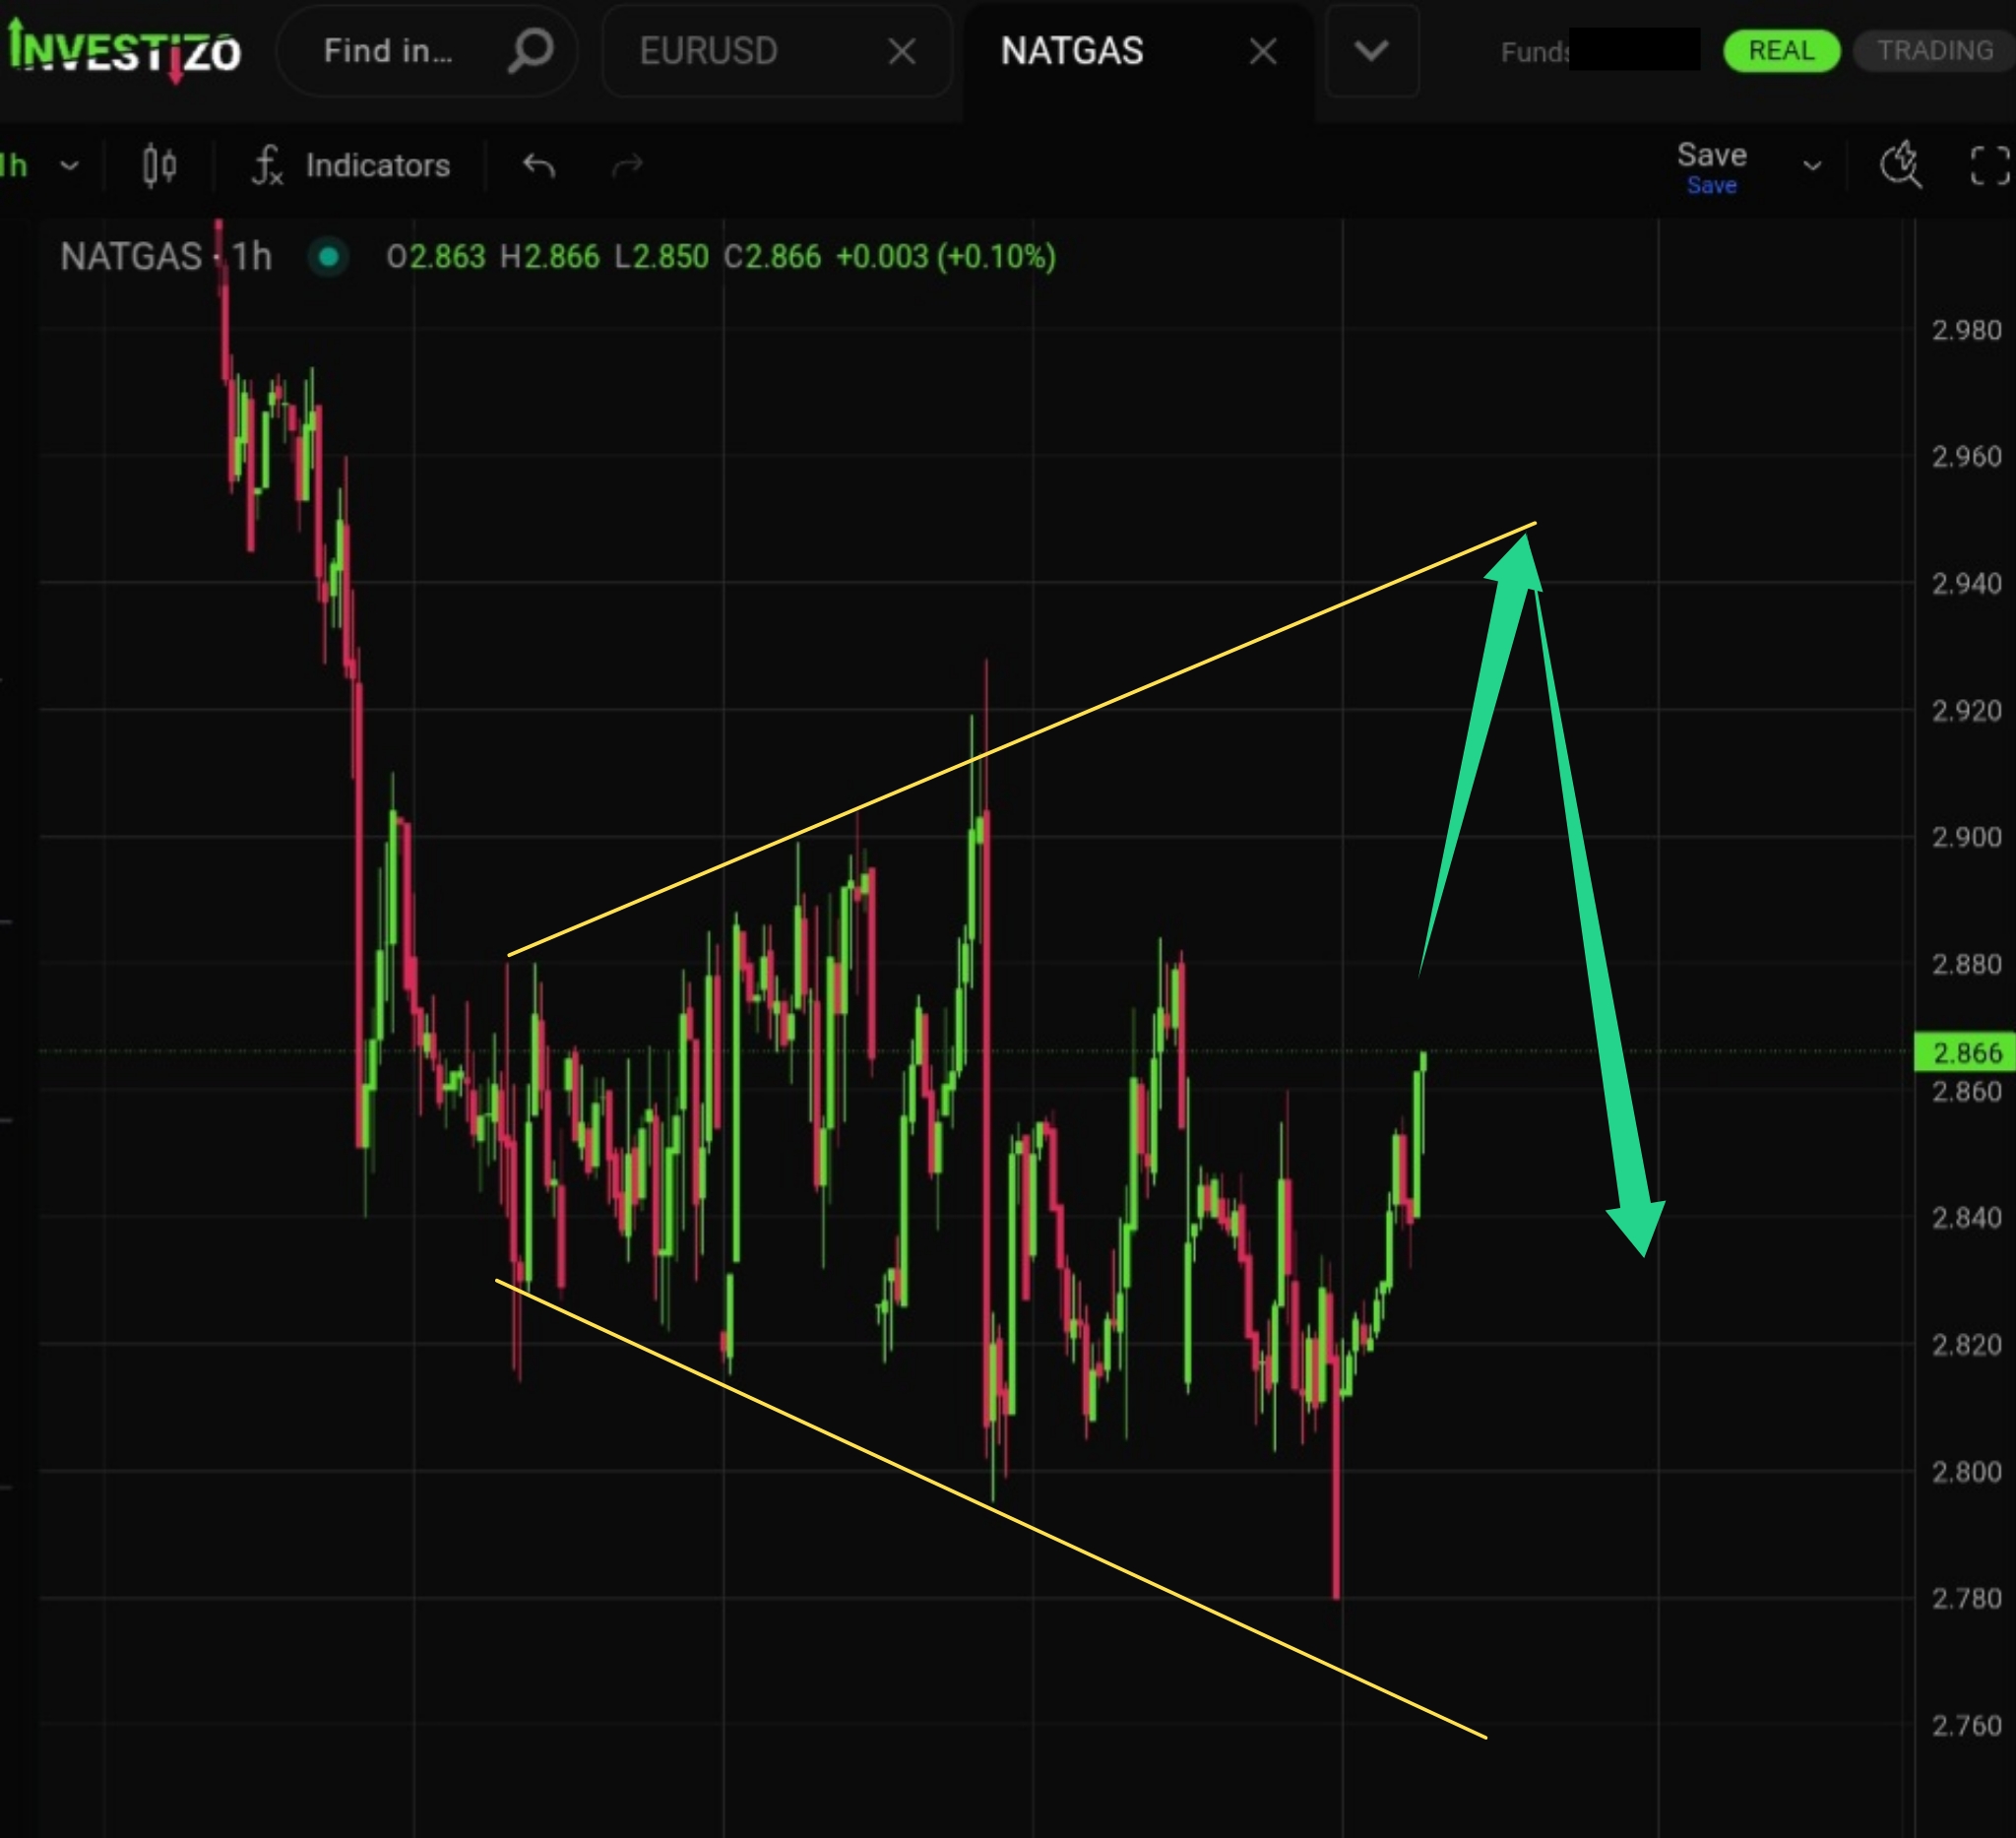
The formation of an expanding “megaphone” (broadening wedge) pattern is being confirmed.
Bitcoin is approaching a critical resistance zone at $67,000–68,000. This area will largely determine the medium-term outlook.
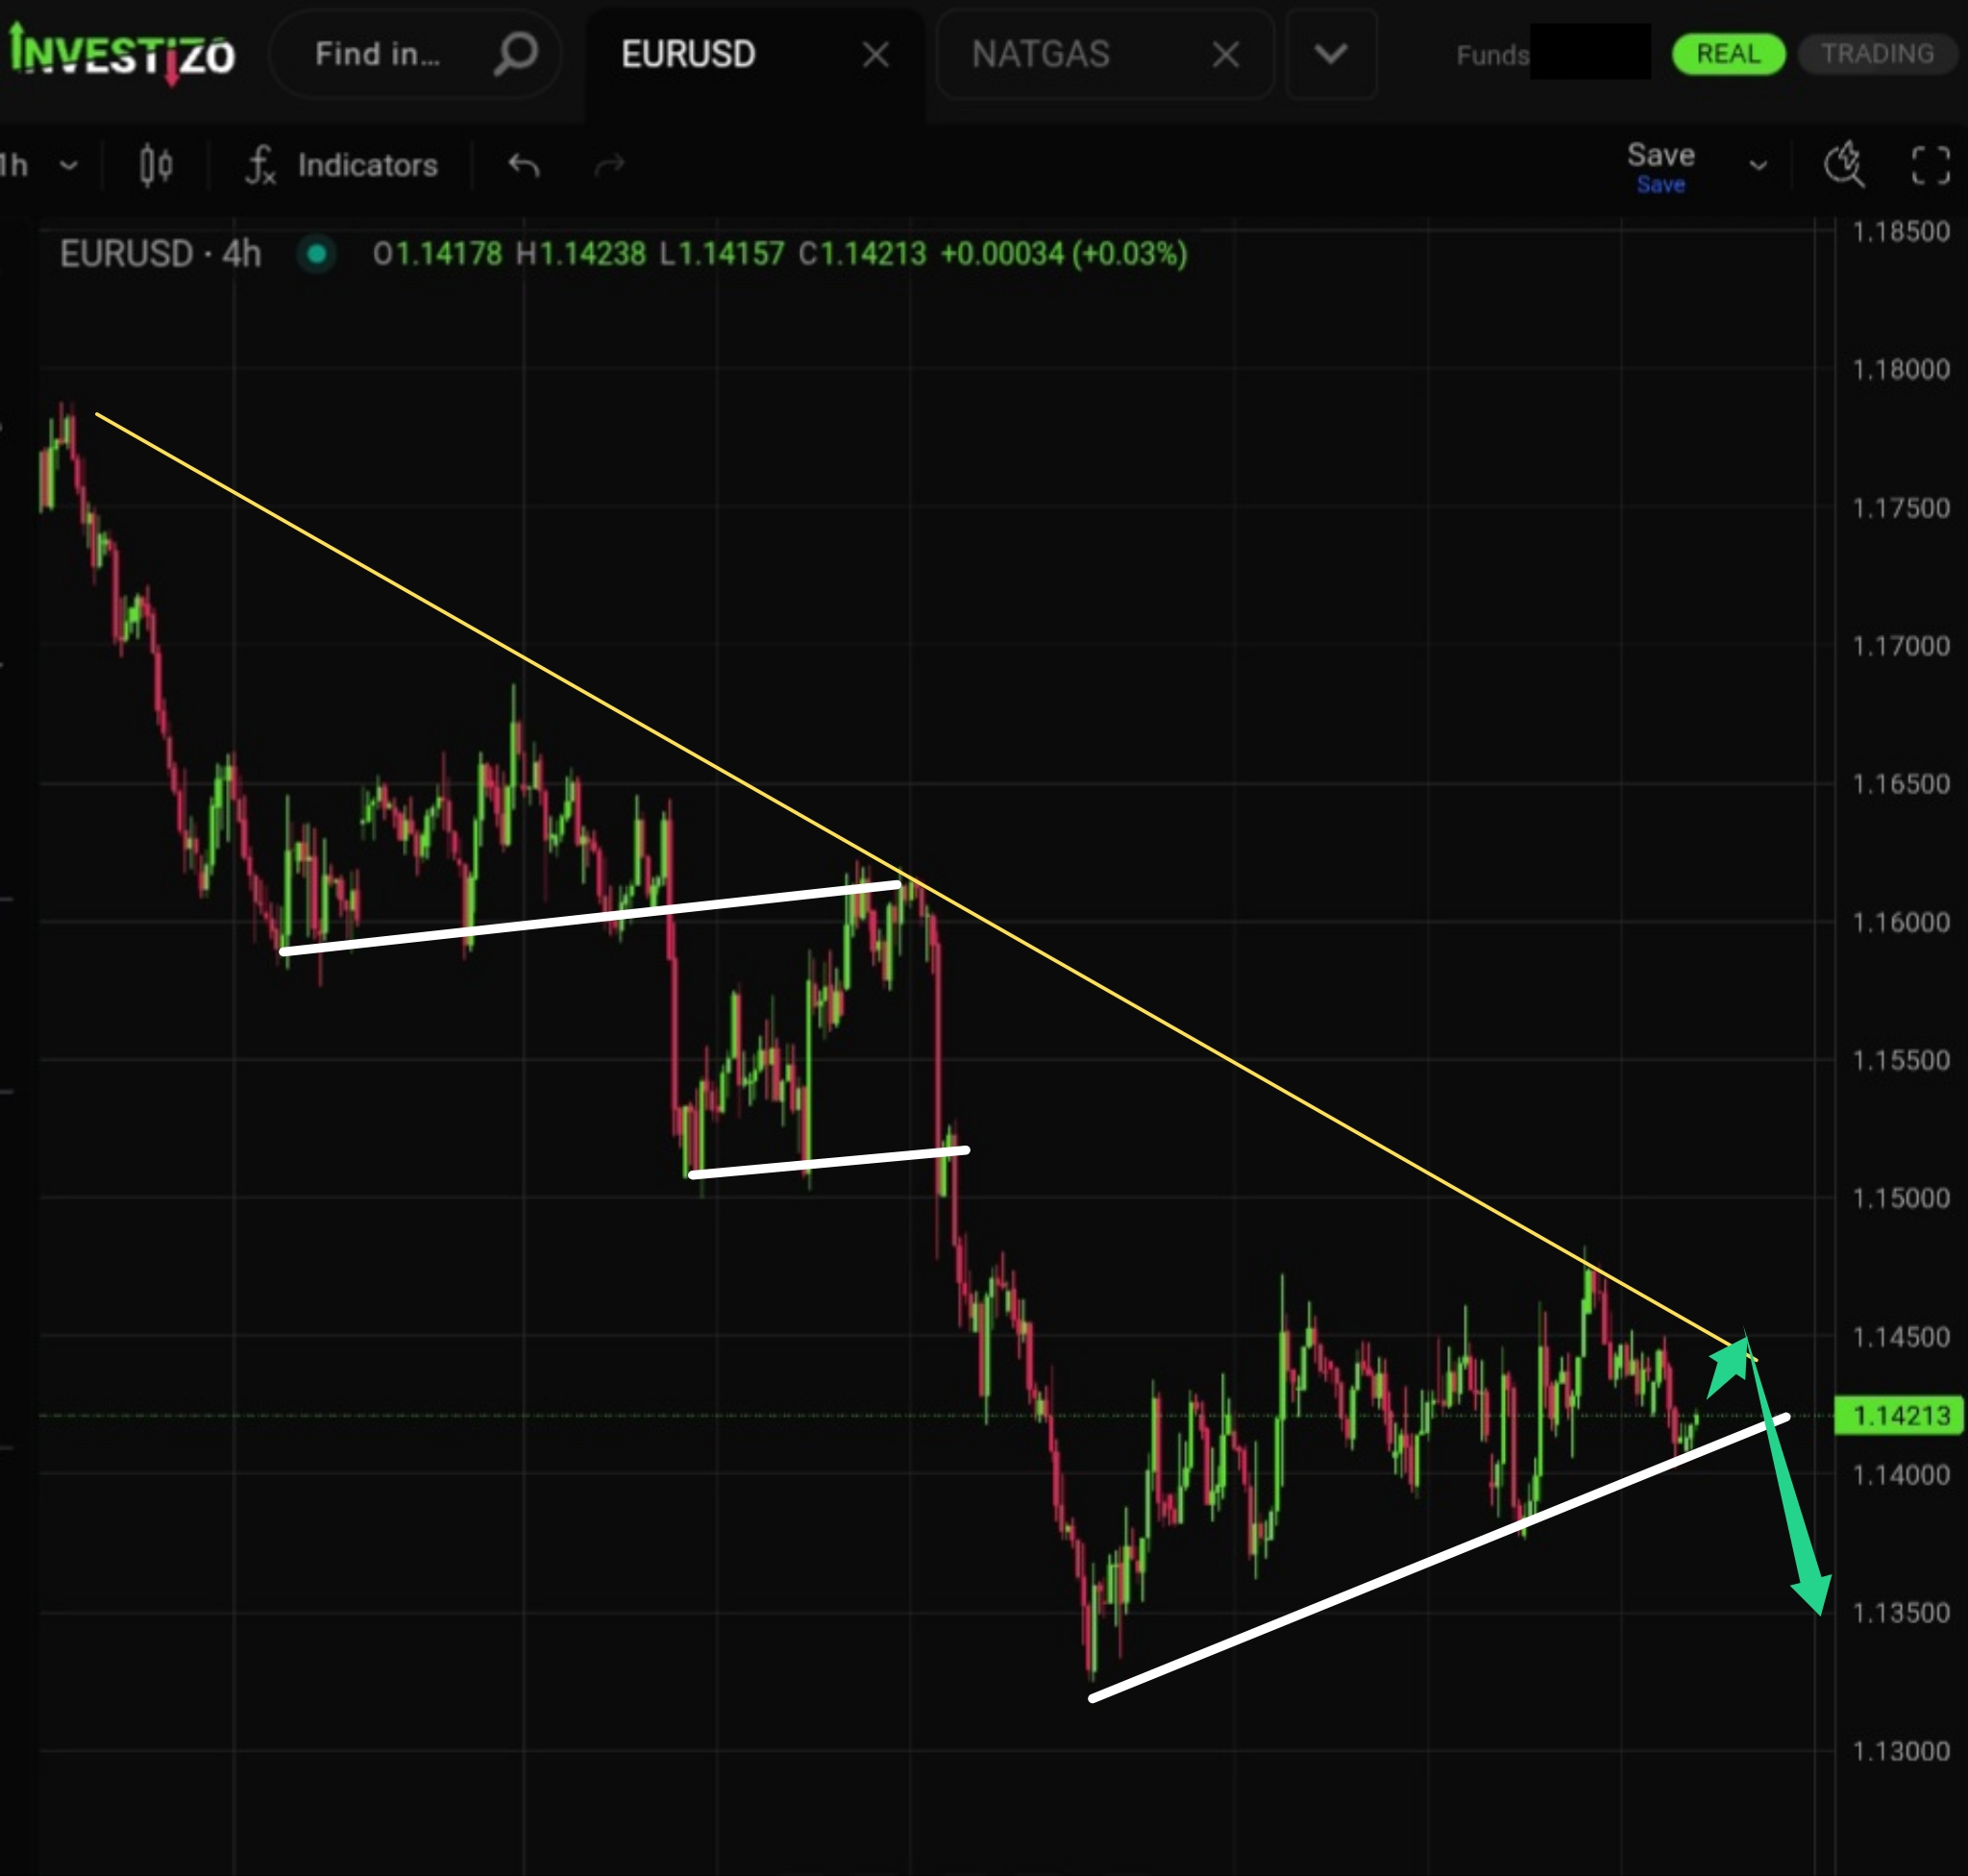
The weakness of the bulls continues to be confirmed.
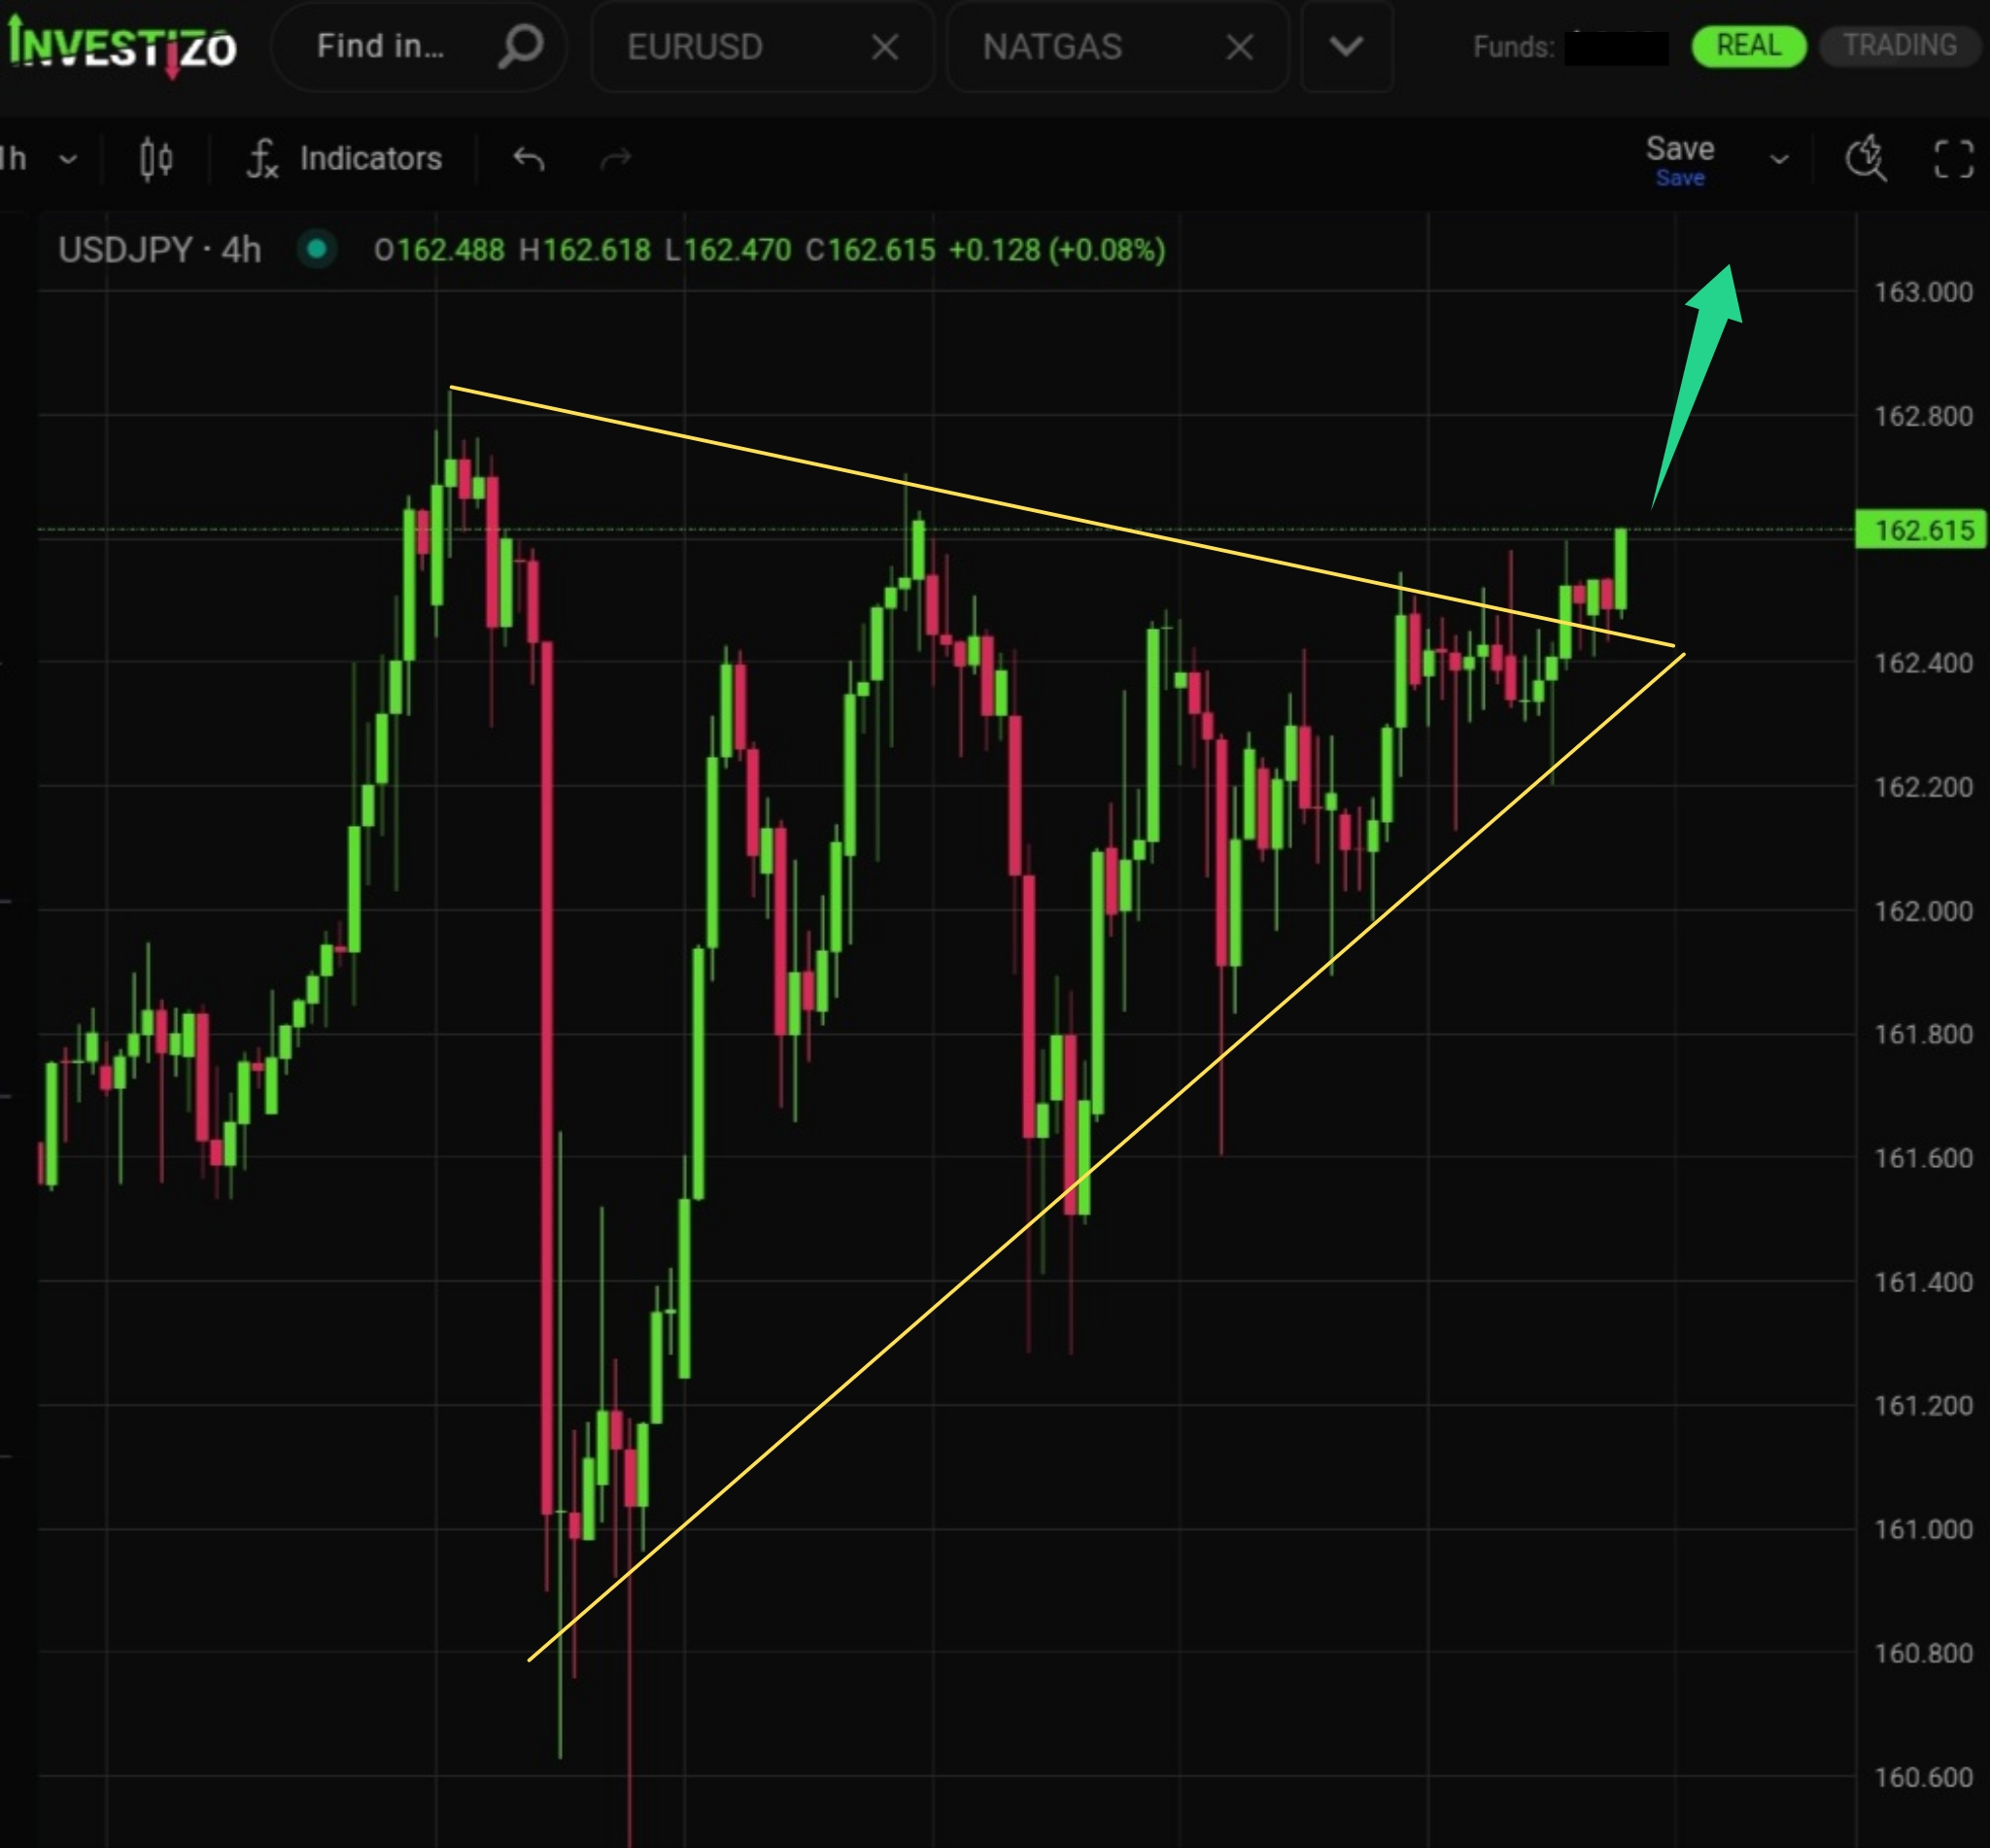
The long-awaited breakout from the triangle has finally occurred. The market has clearly chosen the upside direction.
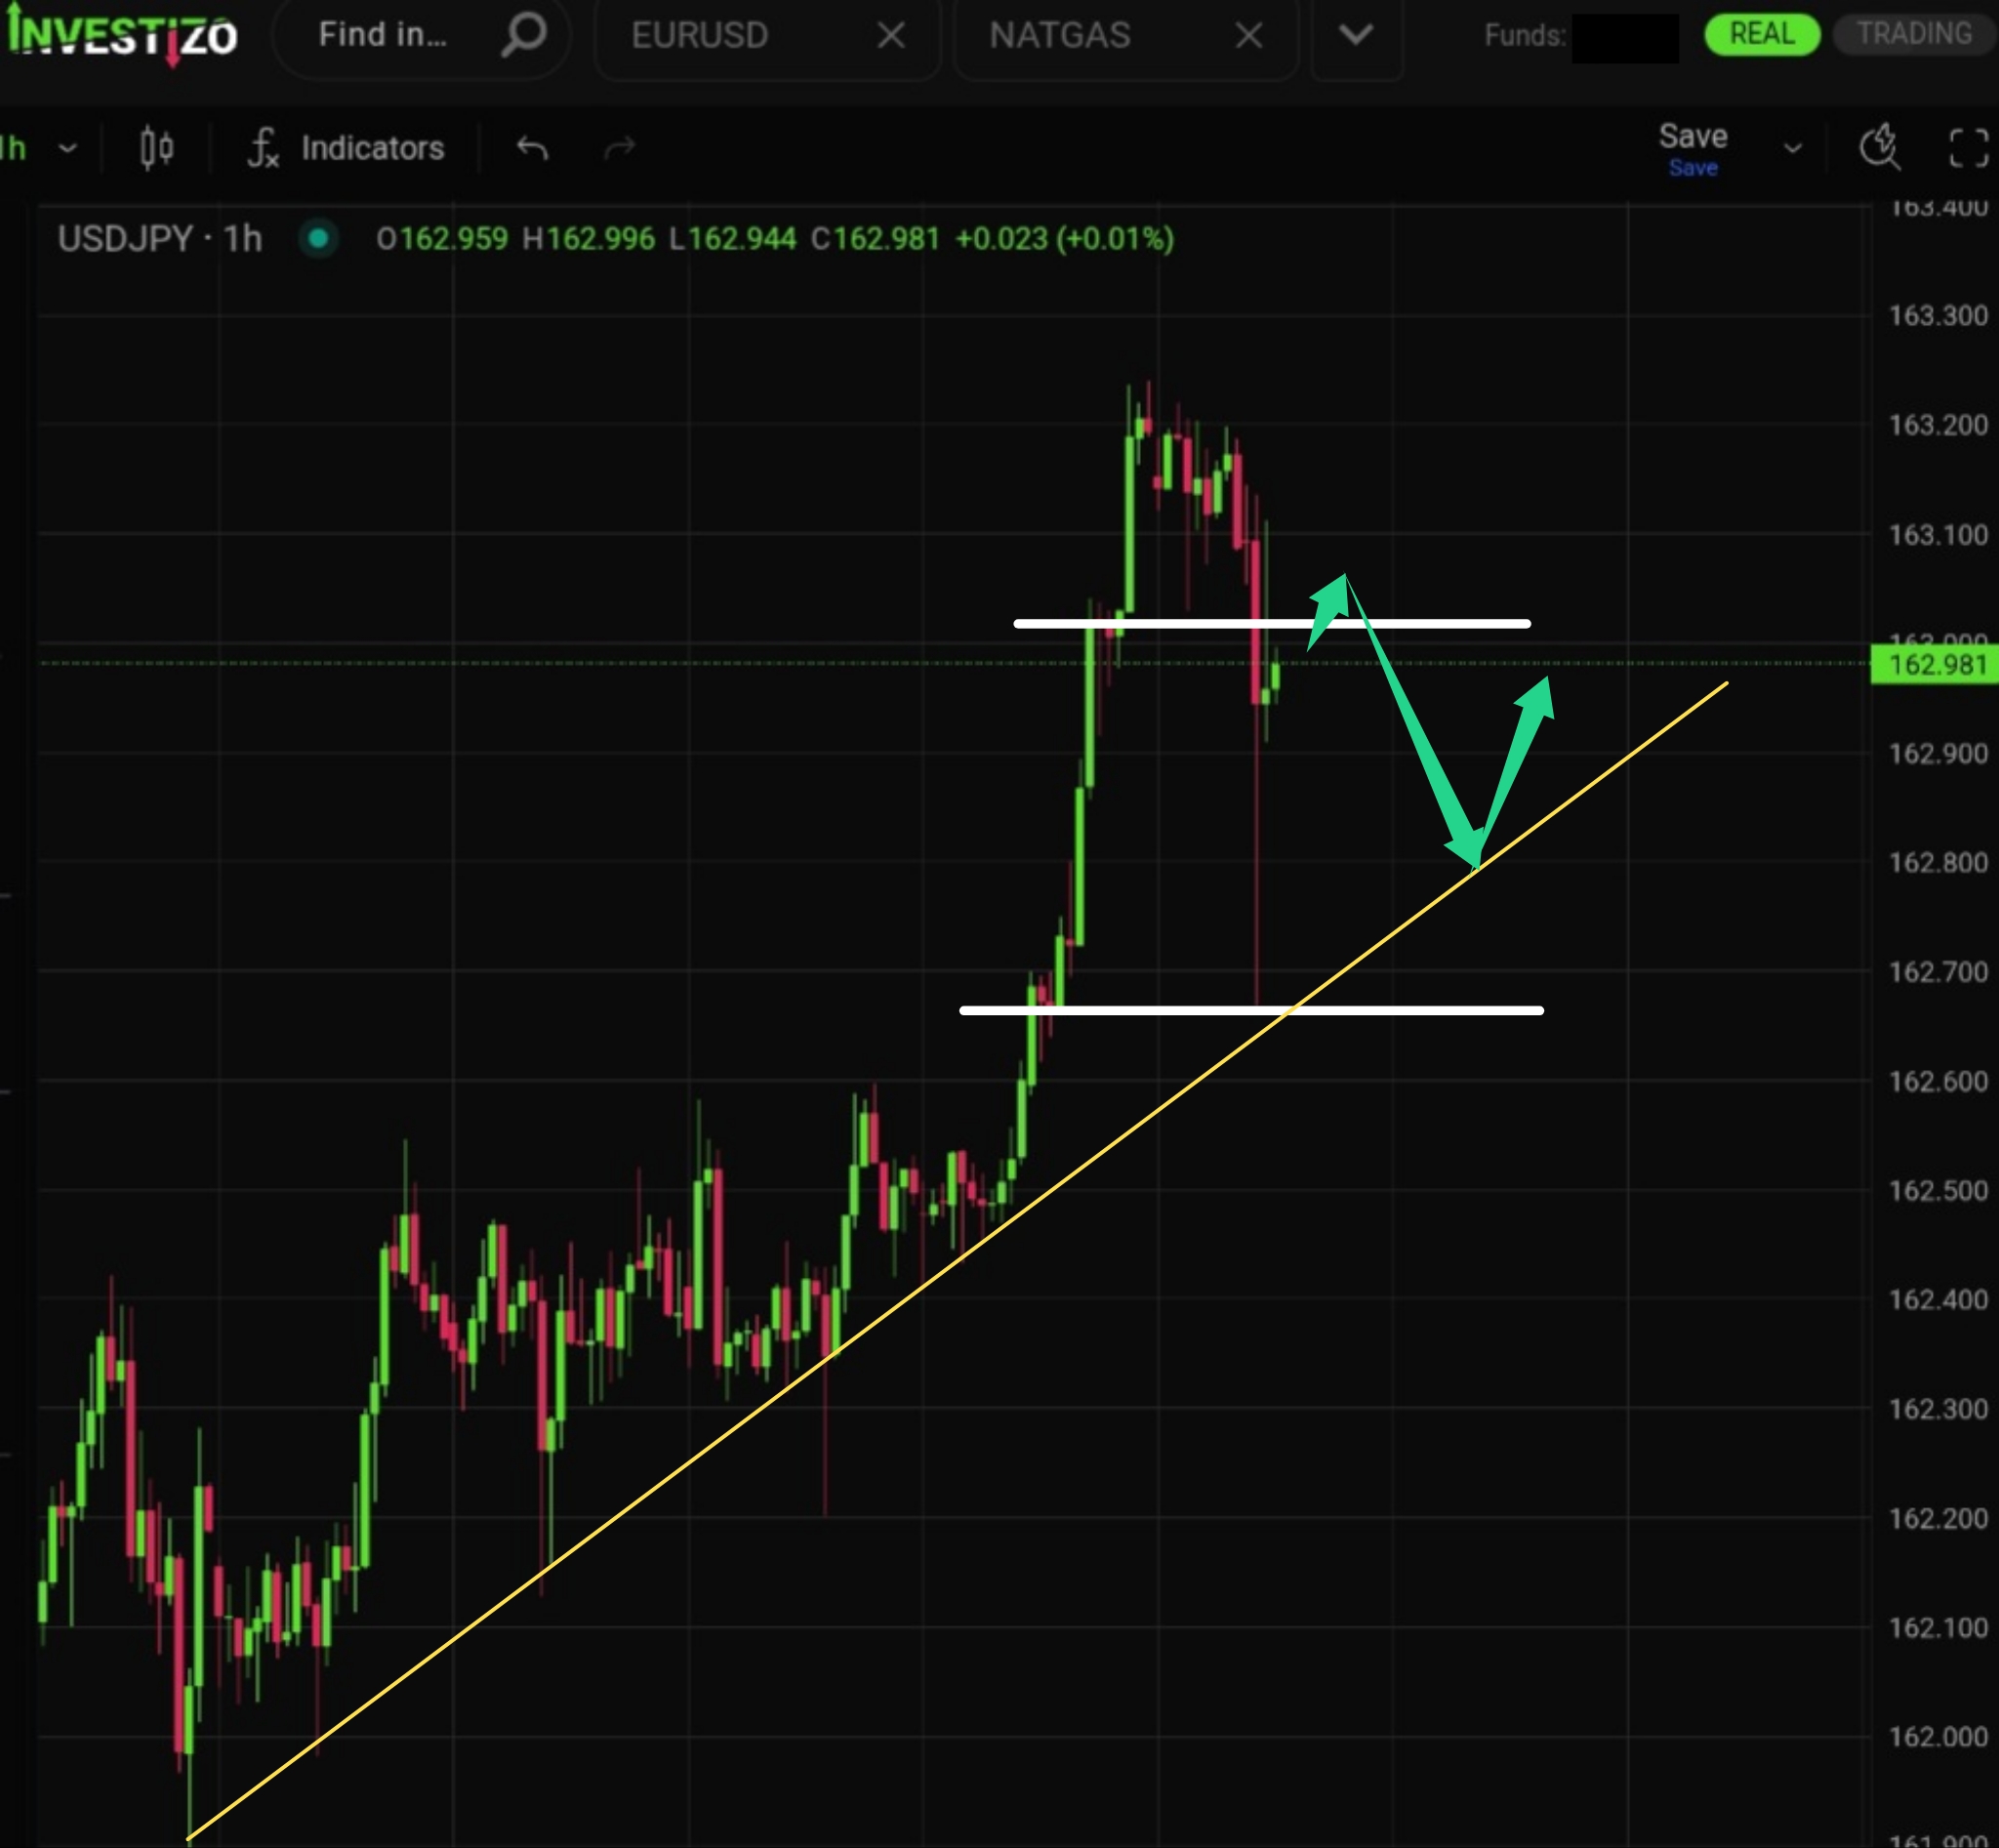
The pair continues to consolidate above the sloping support but is approaching a critical compression of the trading range near the medium-term trendline.
Bitcoin trades at 65,935 this Tuesday morning, holding onto recent gains as short-term market participants return to profitability alongside a broader resurgence in risk appetite.
Brent Crude trades at 86.71 this Tuesday morning, consolidating near its highest levels since June 11.
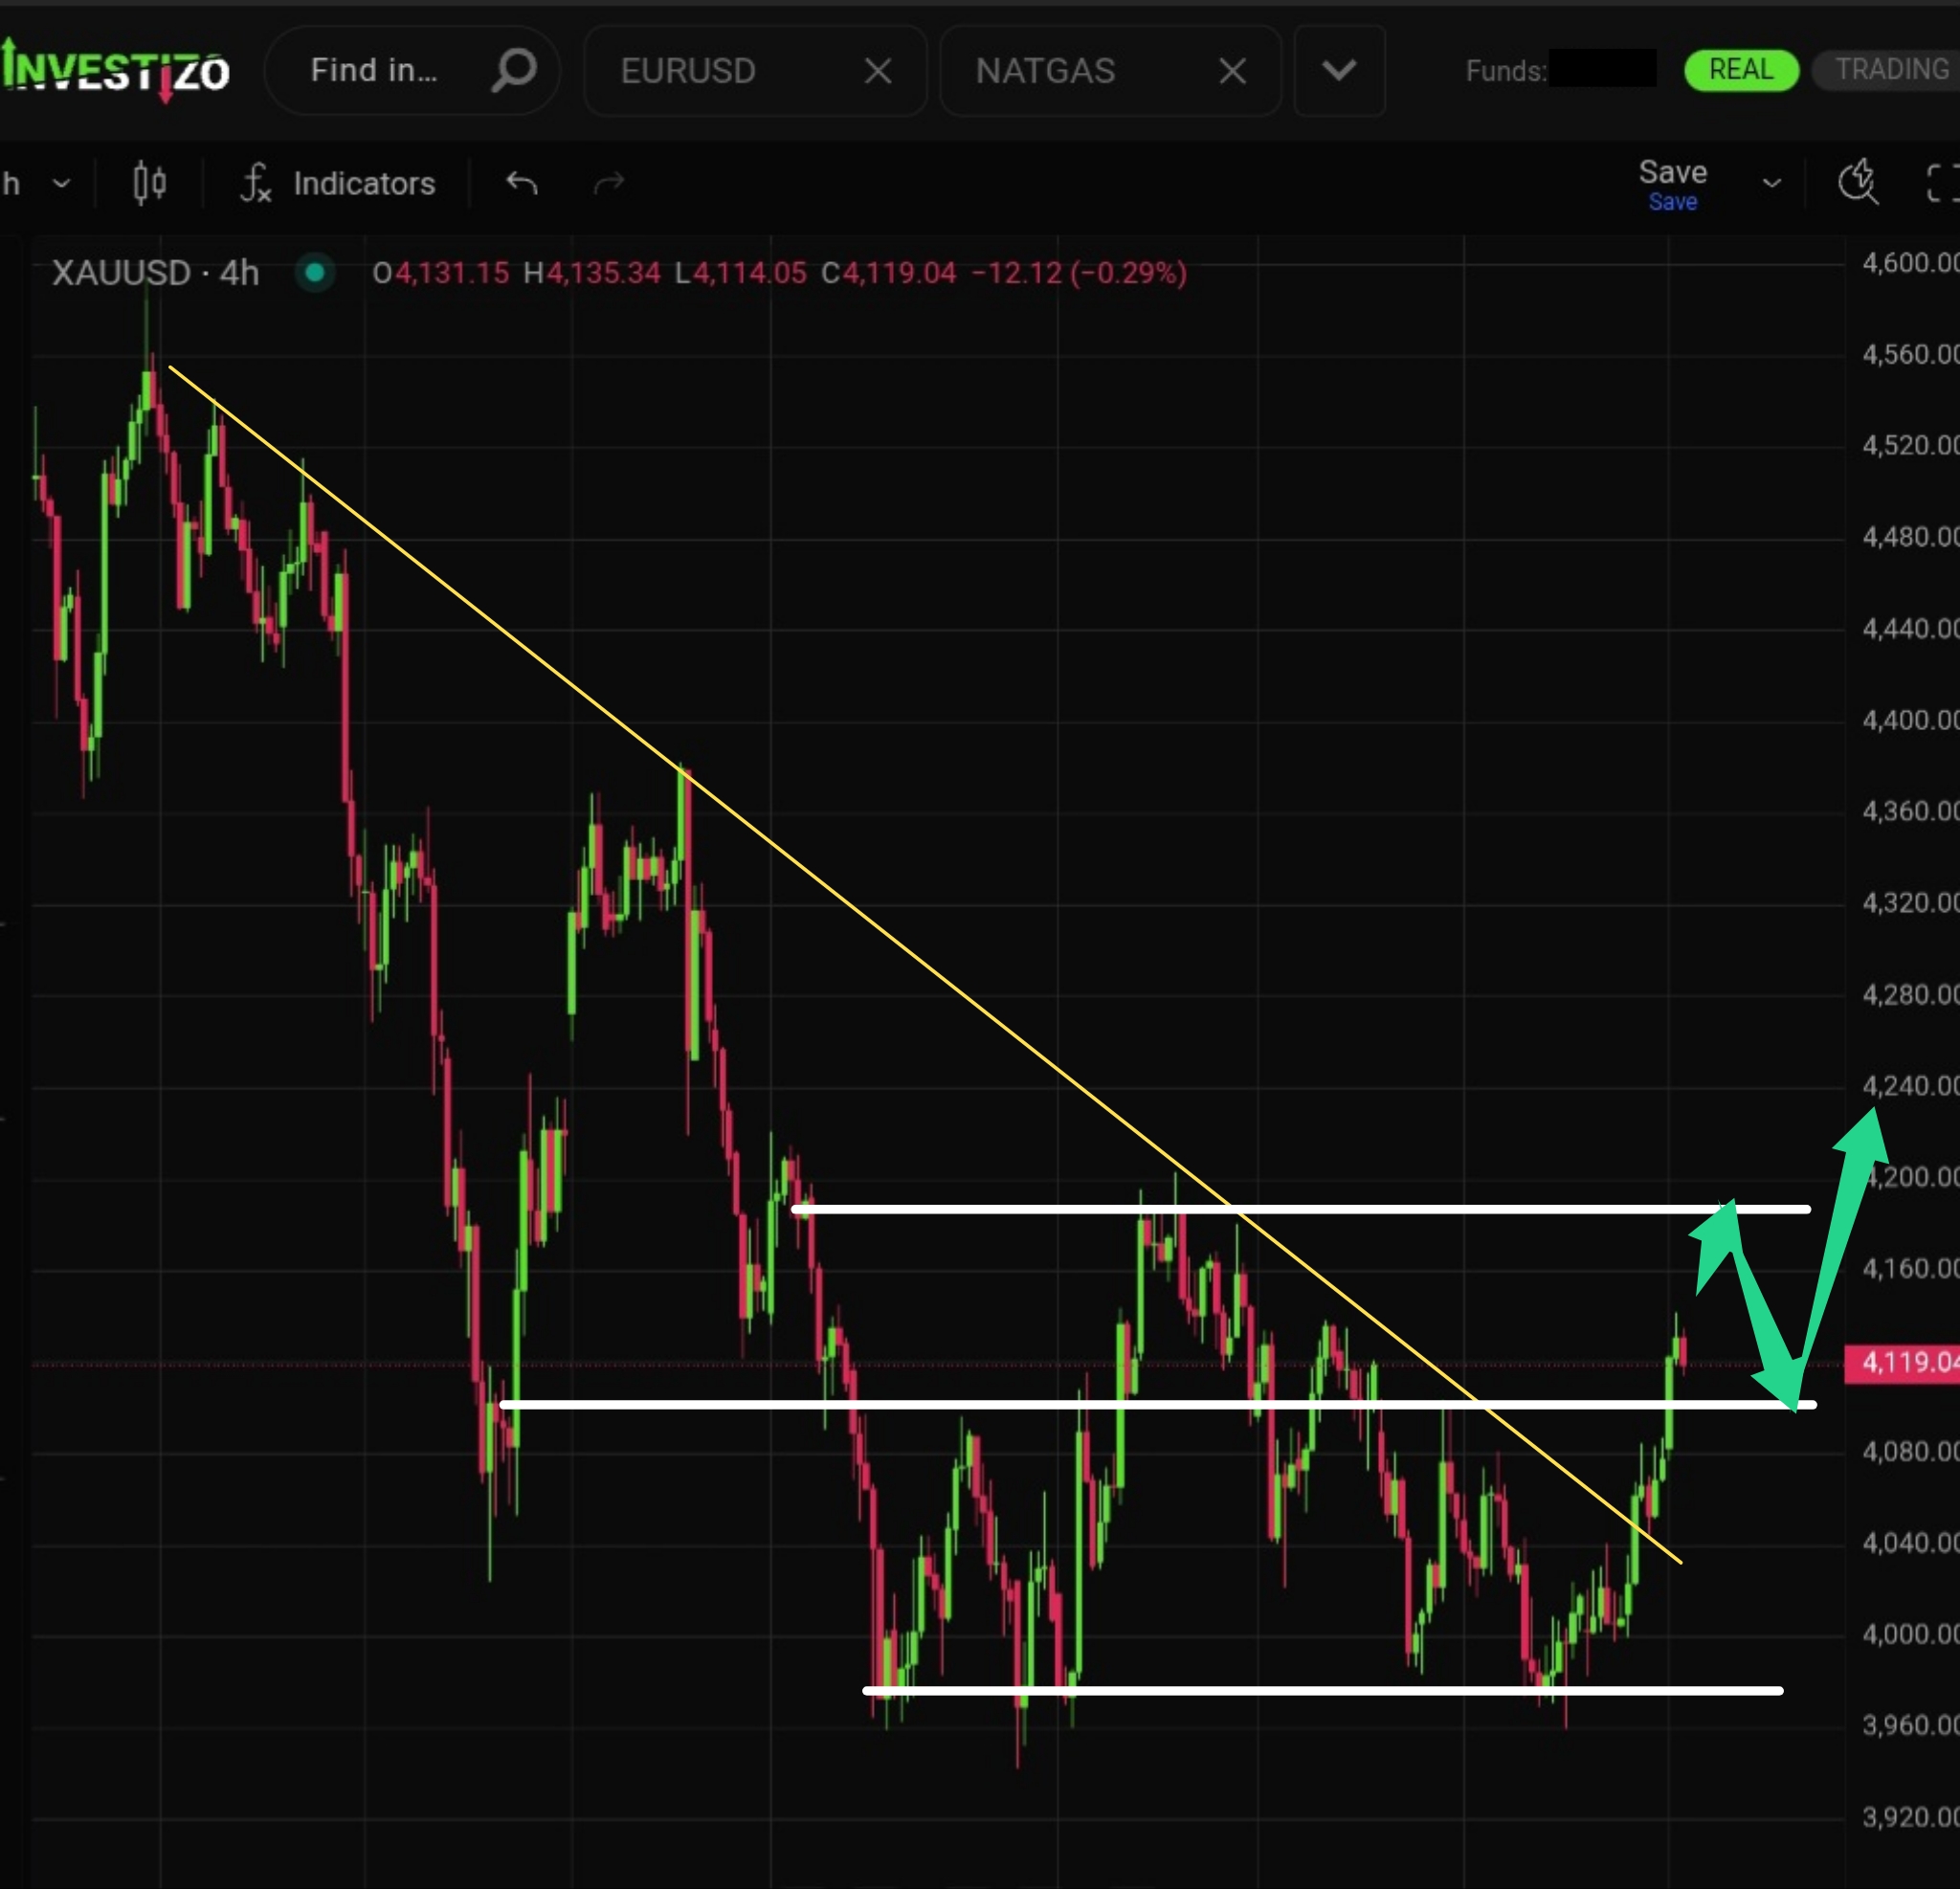
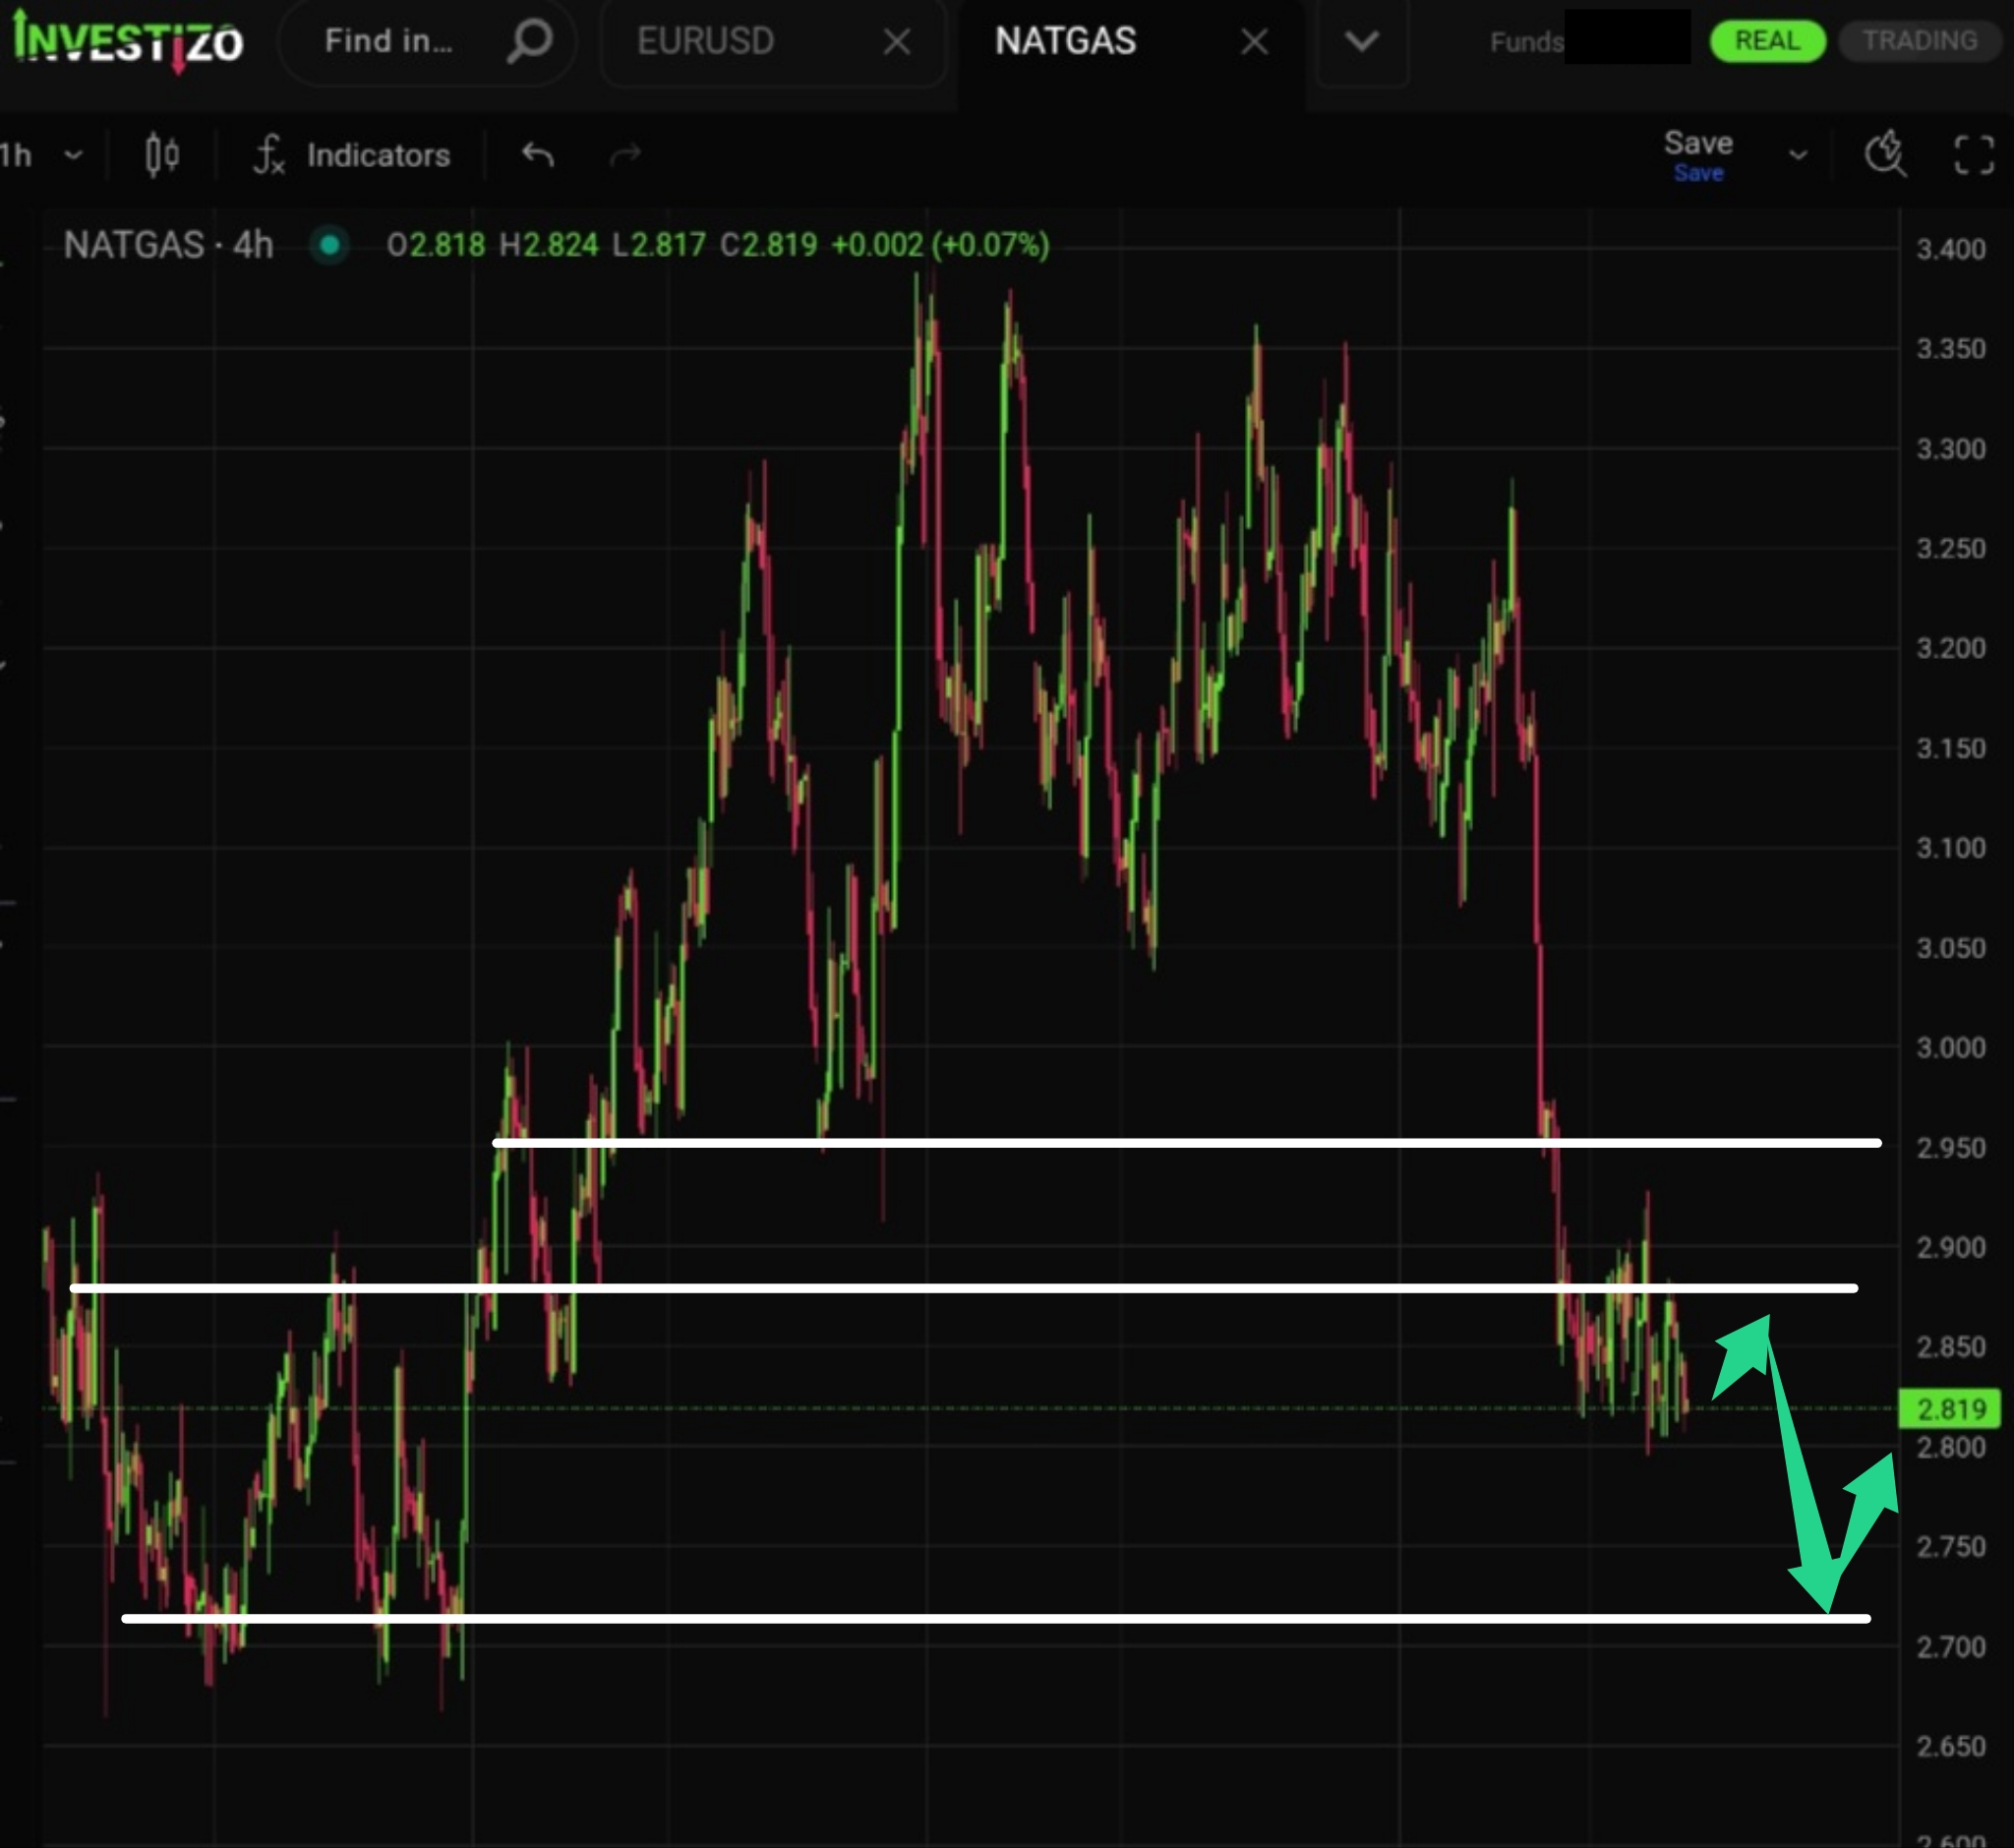
Local support for the price appears unstable. The market will likely need to test the demand zone at 2,700–2,720.