General analysis USDCHF for 07.07.2022
Current dynamics
The USD/CHF pair opened today's trading session with a decline. The pair witnessed positive performance in the last five consecutive sessions. After the pair reached its lowest level since April in last week's session.
The dollar's recent gains came as a result of investors' demand for the dollar as a safe haven, after increasing indications of economic stagnation as a result of central banks' policies to contain inflation.
The minutes of the Federal Reserve meeting showed that the members of the Central Bank agreed on the need to continue raising interest rates in order to combat inflation and prevent it from continuing even in the event of a recession in the economy. US central bank officials acknowledged the possibility of raising interest rates to slow economic growth, but they stressed the need to contain inflation and reduce it towards the target by 2%.
Meanwhile, Kristalina Georgieva, Managing Director of the International Monetary Fund, said that the global economic outlook has become significantly bleak since the last economic update. And she added: A possible global recession in 2023 cannot be ruled out.
The US macroeconomic data showed, the US ISM Services PMI for June fell to 55.3 from 55.9 in May. However, the actual number came in better than market expectations of 54.5. ِAlso the US JOLTS Job Opening for May declined to 11.25 million versus 11.00 million expected and 11.68 million prior.
However, US 10-year Treasury yields rebounded from their lowest level in three weeks to 2.93%, but the higher reading of the two-year bond coupon, around 2.99%, in turn indicates global recession fears.
In view of today's events affecting the pair, on the American side, the he release of the Automatic Data Processing (ADP) Employment Change will remain in focus. as expectations indicate an improvement in the labor market to 200 thousand, which is higher than the previous reading of 230 thousand.Along with initial jobless claims are expected to remain steady at 230K, versus the previous release of 231K.
Support and resistance levels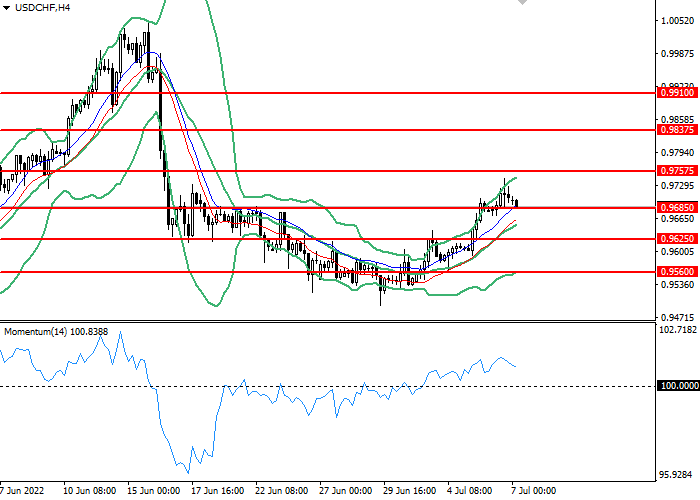
On the 4 hour chart, the instrument failed to consolidate above the Bollinger Bands moving average. The indicator is directed upwards and the price range is widening, which indicates that the current trend is about to continue.The momentum chart is above the 100 level, which gives sell signals. The Envelopes indicator gives buy signals.
- Support levels: 0.96850, 0.96250, 0.95600.
- Resistance levels: 0.97575, 0.98375, 0.99100.
Trading scenarios
- Long positions should be opened at the 0.96850 with a target of 0.97575 and a stop loss at 0.96250. Implementation period: 1-3 days.
- Short positions can be opened at the level of 0.96250 with a target of 0.95600 and a stop-loss at the level of 0.96850. Implementation period: 1-3 days.