General analysis USDCHF for 30.06.2022
Current dynamics
The USD/CHF pair managed to achieve some gains during today's trading session. Thus, the pair stopped losses that lasted for more than two weeks, taking advantage of the previous day's recovery from its lowest level since April.
The dollar's recent gains were supported by Federal Reserve Chairman Jerome Powell's statements during the European Central Conference, despite the release of weak economic data. Where Powell confirmed, that the economy is still maintaining its strength and is still coherent, while stressing the strength of the labor market in the United States of America, and that it is still able to absorb the developments of the current economic situation.He reiterated bets on tighter policy tightening to combat high inflation and underlined the Fed's ability to succeed in bringing inflation down to the 2% target while maintaining a strong employment pace.
In addition to the statements of the Fed members that the central bank will raise interest rates by 75 basis points at the next July meeting.
On the other hand, US macroeconomic data revealed that the final reading of the gross domestic product recorded a contraction in the first quarter of 1.6%, exceeding expectations of recording a contraction of 1.5%.
The stock markets on Wall Street witnessed a strong fall, as the Dow Jones index fell today, Thursday, in the pre-trading period of 1.2%, and the Nasdaq fell by 2%, while the Standard & Poor's 500 index fell in the range of 1.5%.
Where some may see, that the state of risk aversion on the part of investors as a result of the increase in recession fears and the rapid continuation of raising interest rates, as illustrated by the daily losses of US stocks, should serve as a tailwind for the dollar as a safe haven.
Key events in the US macroeconomics this week: PCE, Core PCE, Personal Income, Personal Spending Thursday, along with the manufacturing ism, the final manufacturing PMI tomorrow Friday.
Support and resistance levels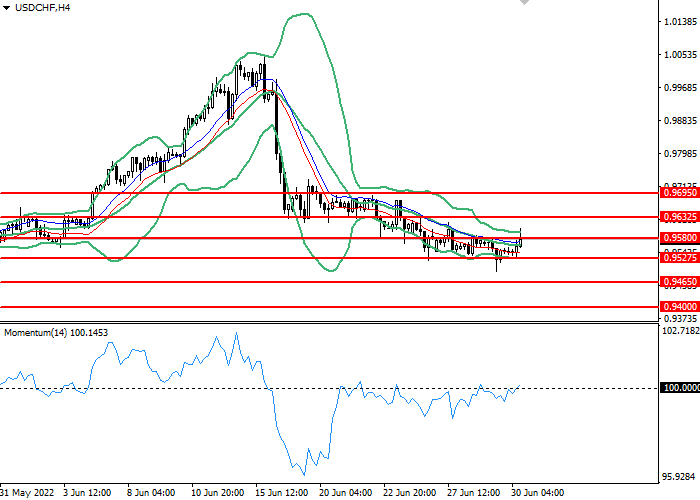
On the 4 hour chart, the instrument is testing a consolidation above the Bollinger Bands moving average. The indicator is directed sideways and the price range is narrowing, indicating that the current trend is about to change.The momentum chart is below the 100 level, which is giving buy signals. The Envelopes indicator gives sell signals.
- Support levels: 0.95275, 0.94650, 0.94000.
- Resistance levels: 0.95800, 0.96325, 0.96950.
Trading scenarios
- Long positions should be opened at the 0,95800 with a target of 0.96325 and a stop loss at 0.95275. Implementation period: 1-2 days.
- Short positions can be opened above the level of 0.95275 with a target of 0.94650 and a stop-loss at the level of 0,95800. Implementation period: 1-2 days.