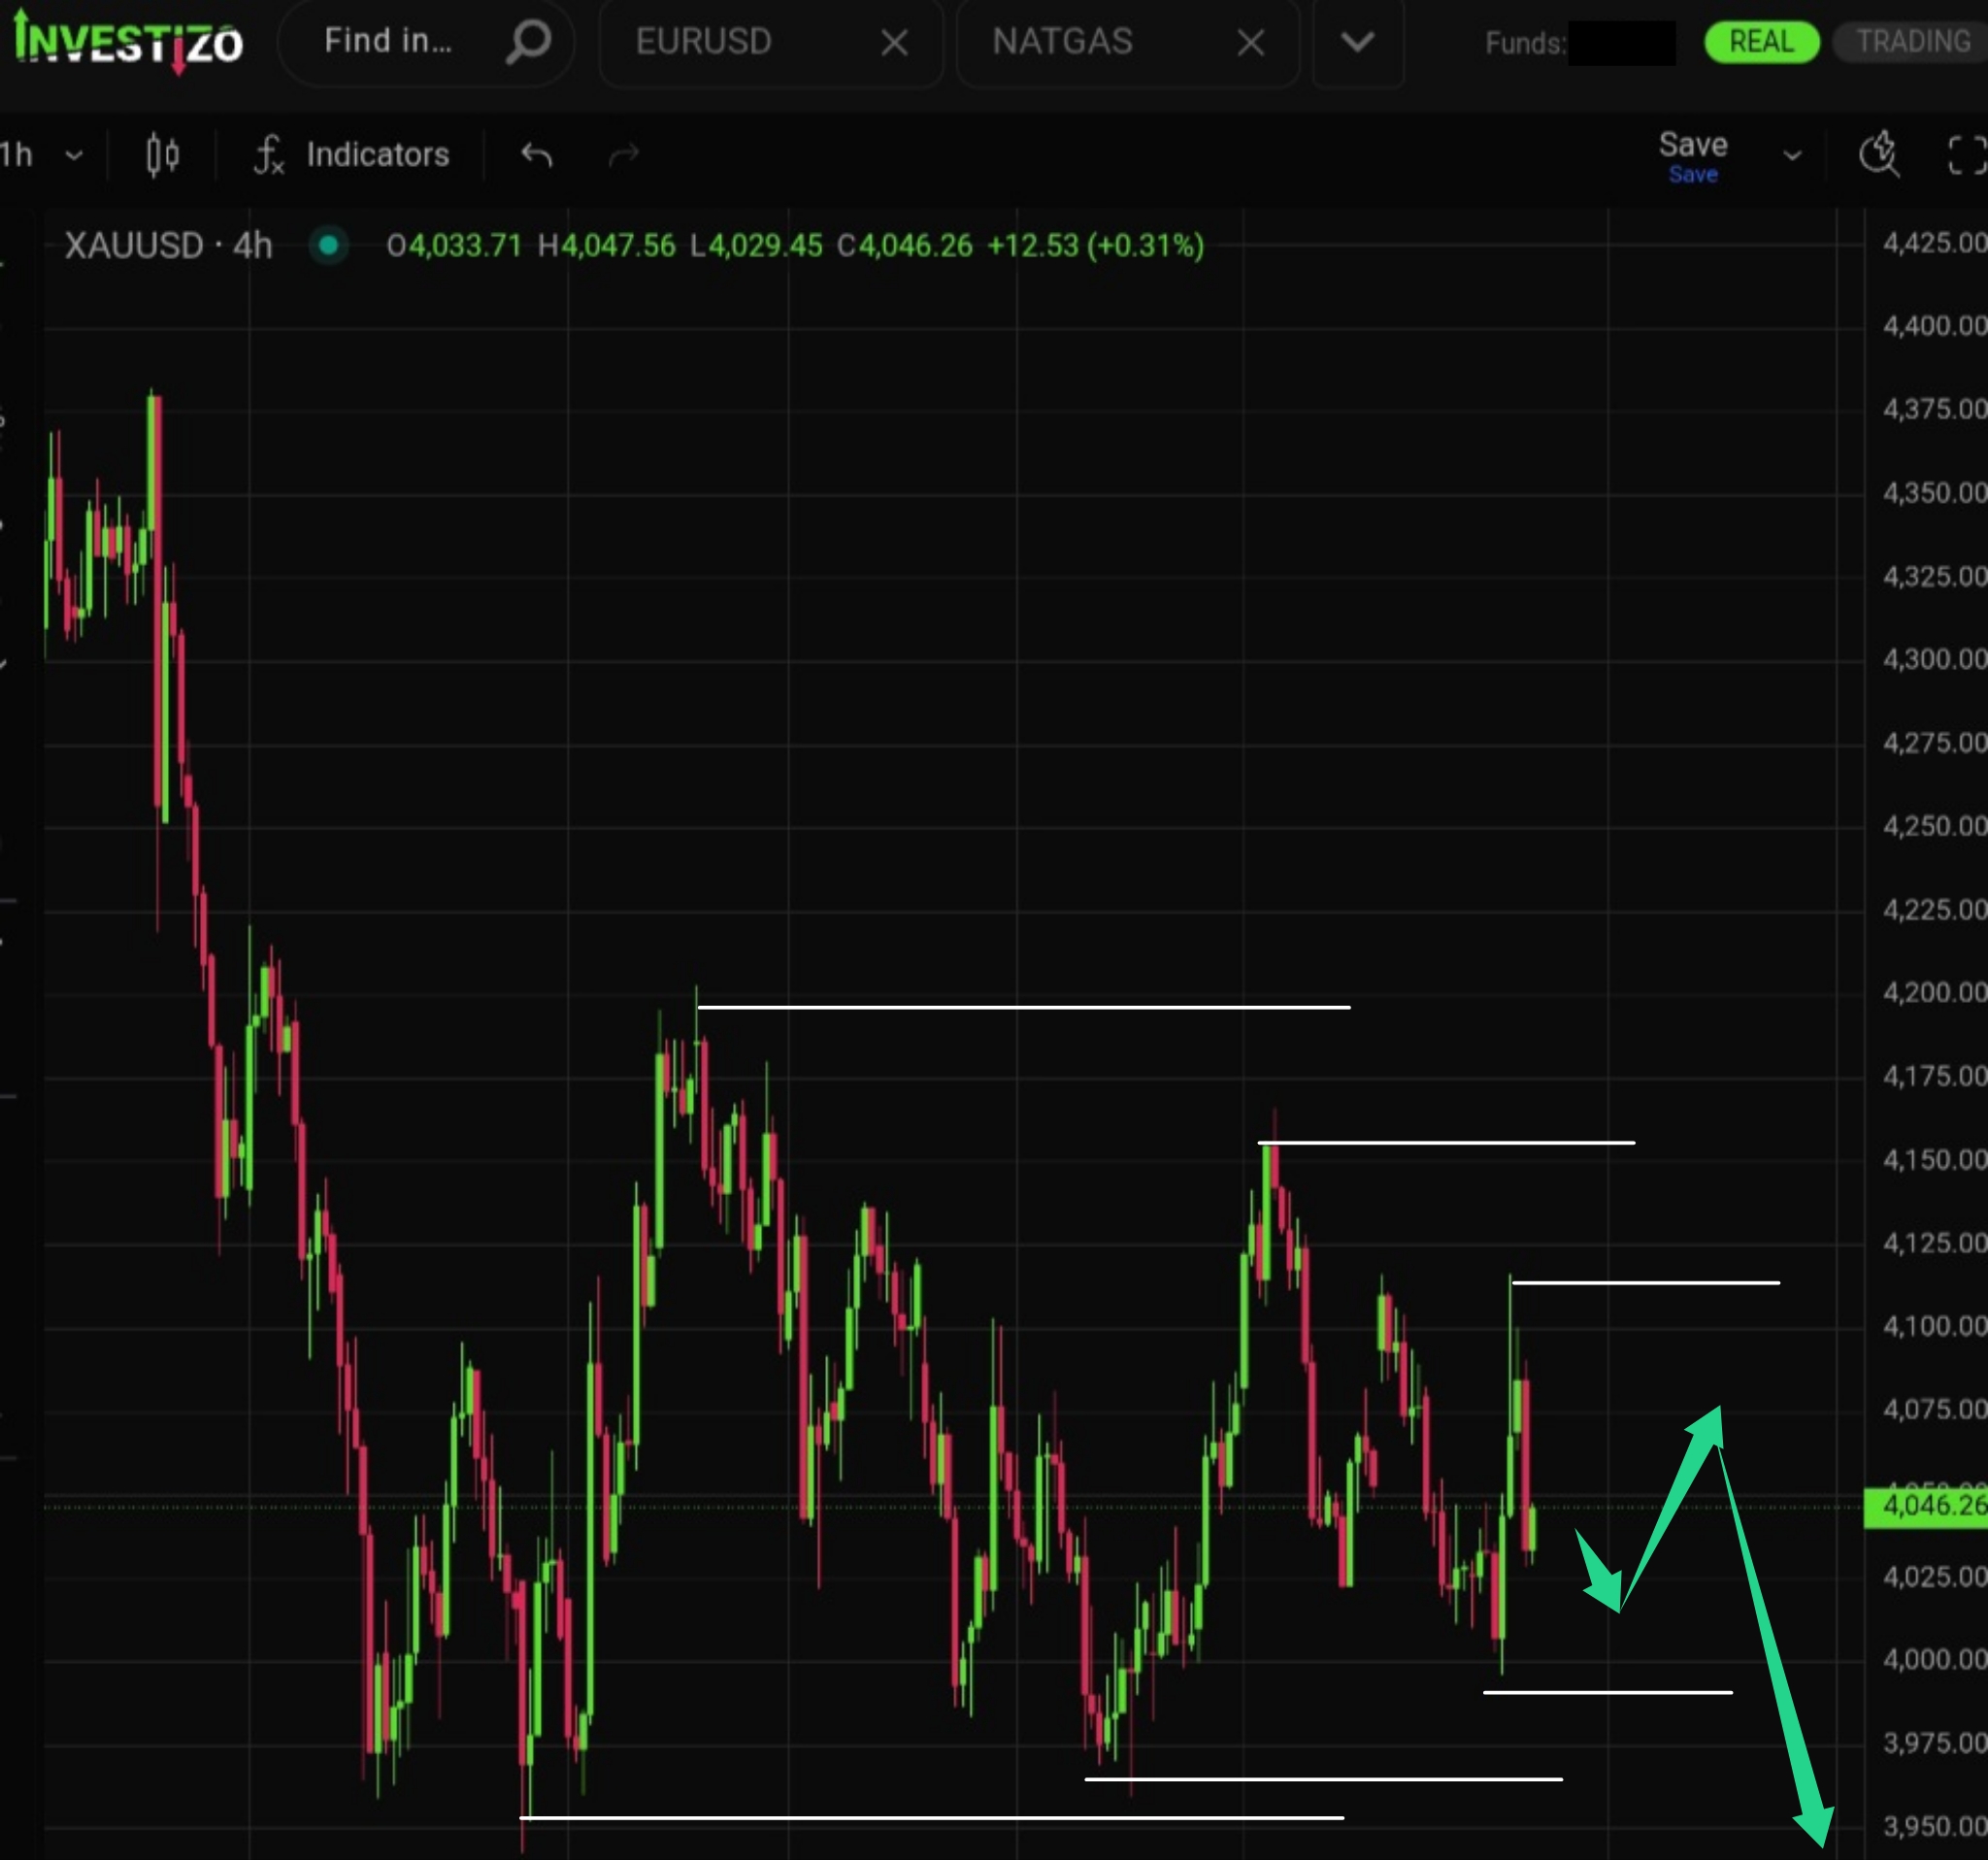
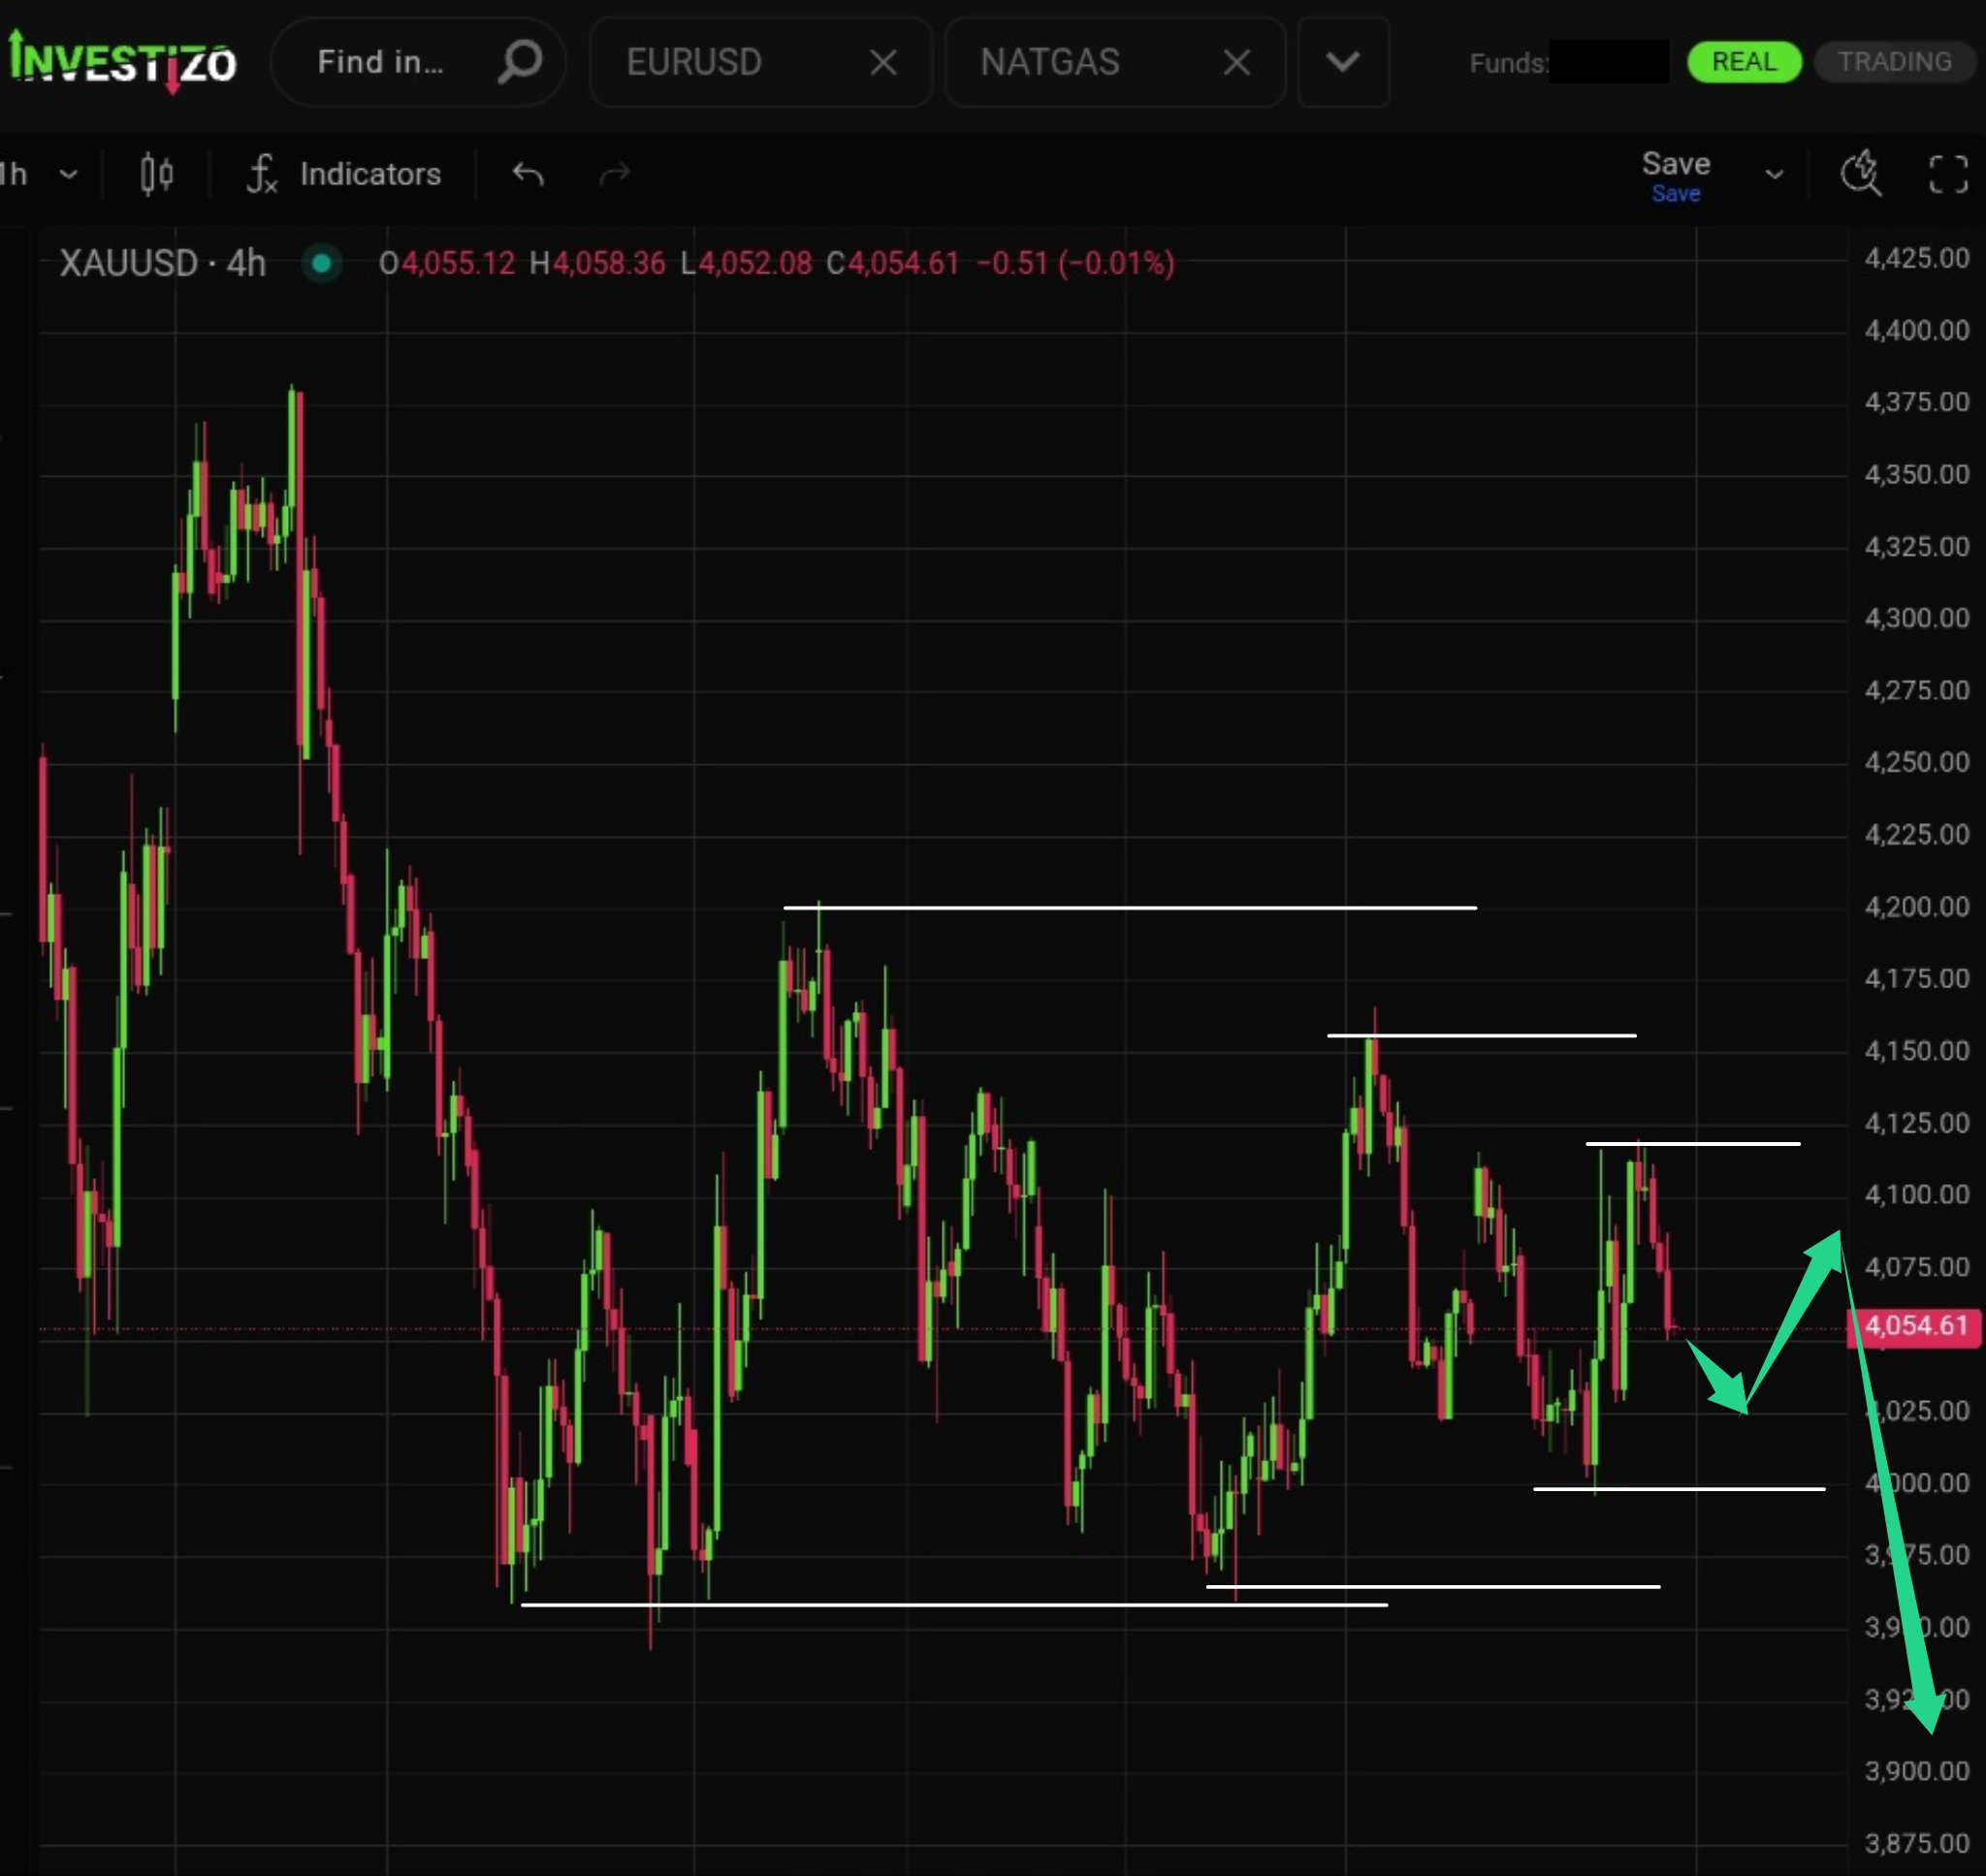
XAUUSD H1: The Ichimoku Forecast for the American Session on 18.3.2025

XAUUSD H1: The Ichimoku Forecast for the American Session on 18.3.2025

The most significant signal of the previous trading sessions was the intersection of the Tenkan and Kijun lines, which is considered as a signal of a change in trend in...

USDCAD H1: The Ichimoku Forecast for the American Session on 18.3.2025

USDCAD H1: The Ichimoku Forecast for the American Session on 18.3.2025

The key moment of previous trading sessions was the intersection of the Tenkan and Kijun lines. This signal is marked on the chart with a pink square and indicates a...

USDJPY H1: The Ichimoku Forecast for the American Session on 18.3.2025

USDJPY H1: The Ichimoku Forecast for the American Session on 18.3.2025

One of the main signals of previous trading sessions was the intersection of the Tenkan and Kijun lines. This area is marked with a pink square on the graph. The...

XAUUSD H1: The Chaos Theory Forecast for the American Session on 18.3.2025

XAUUSD H1: The Chaos Theory Forecast for the American Session on 18.3.2025

Traditionally, the review begins with examination of the first market dimension. The price has risen above the upper fractal. This defines the phase space as northern. This signal indicates the...

USDCAD H1: The Chaos Theory Forecast for the American Session on 18.3.2025

USDCAD H1: The Chaos Theory Forecast for the American Session on 18.3.2025

The price has fallen below the lower fractal on the chart. This defines the phase space as southern. Accordingly, the most probable scenario for the price change is its decrease....

USDJPY H1: The Chaos Theory Forecast for the American Session on 18.3.2025

USDJPY H1: The Chaos Theory Forecast for the American Session on 18.3.2025

Traditionally, the review begins with examination of the first market dimension. The price has risen above the upper fractal. This defines the phase space as northern. This signal indicates the...

GBPUSD H1: The Chaos Theory Forecast for the American Session on 18.3.2025

GBPUSD H1: The Chaos Theory Forecast for the American Session on 18.3.2025

The review begins with the analysis of the first dimension of the market. The price has fallen below the lower fractal, located outside the Alligator's mouth. Therefore, the phase space...

Brent H1: The Ichimoku Forecast for the American Session on 18.3.2025

Brent H1: The Ichimoku Forecast for the American Session on 18.3.2025

One of the main signals of previous trading sessions was the intersection of the Tenkan and Kijun lines. This area is marked with a pink square on the graph. The...

Bitcoin H1: The Ichimoku Forecast for the American Session on 18.3.2025

Bitcoin H1: The Ichimoku Forecast for the American Session on 18.3.2025

During previous trading sessions, the intersection of the Tenkan and Kijun lines, marked with a pink square, was observed on the Bitcoin chart. This signal indicates a potential change in...

EURUSD H1: The Ichimoku Forecast for the American Session on 18.3.2025

EURUSD H1: The Ichimoku Forecast for the American Session on 18.3.2025

Analysis of the market situation, developed in previous trading sessions, shows the intersection of the Tenkan and Kijun lines. Typically, this signal indicates an upcoming increase, but subsequently the price...

Brent H1: The Chaos Theory Forecast for the American Session on 18.3.2025

Brent H1: The Chaos Theory Forecast for the American Session on 18.3.2025

First of all, let's examine the first market dimension which is a key point in determination the further strategy of behavior of a trader or investor within the framework of...

EURUSD H1: The Chaos Theory Forecast for the American Session on 18.3.2025

EURUSD H1: The Chaos Theory Forecast for the American Session on 18.3.2025

The further direction of movement for EURUSD hasn't been defined yet. The phase space remains undefined. Against this background, it's worth being patient and waiting for the price to rise...

XAUUSD H1: The Ichimoku Forecast for the European Session at 18.3.2025

XAUUSD H1: The Ichimoku Forecast for the European Session at 18.3.2025

The most significant signal of the previous trading sessions was the intersection of the Tenkan and Kijun lines, which is considered as a signal of a change in trend in...

USDCAD H1: The Ichimoku Forecast for the European Session at 18.3.2025

USDCAD H1: The Ichimoku Forecast for the European Session at 18.3.2025

During previous trading sessions, the intersection of the Tenkan and Kijun lines, marked with a pink square, was observed on the USDCAD chart. This signal indicates a potential change in...

USDJPY H1: The Ichimoku Forecast for the European Session at 18.3.2025

USDJPY H1: The Ichimoku Forecast for the European Session at 18.3.2025

The most significant signal of the previous trading sessions was the intersection of the Tenkan and Kijun lines, which is considered as a signal of a change in trend in...