General analysis USDCAD for 15.07.2022
Current dynamics
The USD/CAD pair opened today's trading session with a decline. To complete his strong reflection during his recent sessions.After rising from its weekly low to its highest level since November 2020 at 1,32235.
Looking at the reasons for the pair's volatility in recent sessions, the pair's decline came after the Bank of Canada raised the interest rate by 100 basis points to 2.5% in June, compared to market expectations for a rate increase of 75 basis points. The Bank of Canada statement said: With demand clearly increasing in the economy, inflation rising and widening, and more businesses and consumers expecting high inflation to continue for longer, the Board of Governors has decided to step up the path to higher interest rates.
However, the US macroeconomic data, which mainly indicates rising inflation to increase the chances that the Federal Reserve will implement a 100 basis point increase in July, came to be the main reason for the pair to reach its highest level in two years.
The US Bureau of Labor Statistics reported that the Producer Price Index (PPI) for final demand in the US rose to 11.3% on an annual basis in June from 10.9% in May, beating expectations of 10.7%. Additionally, there were 244,000 initial jobless claims in the week ending July 9 versus the previous week's reading of 235,000 and market expectations of 235,000. Weekly jobless claims were the highest in five months. The US Consumer Price Index (CPI) for June jumped higher 40-year level at 9.1% y/y vs. 8.8% expected and 8.6% previously.
On the other hand, some members of the Federal Reserve came in conflicting statements regarding the rate of interest rate hike in the upcoming meeting, as Federal Reserve member Rafael Bostic said this week that higher than expected inflation rates put the Fed funds rate increase by 100 basis points on the table. Another Fed member, Christopher Waller, said a 75 basis point hike at this meeting makes us neutral, adding that I think it makes sense that we have a stagnation in growth where it drops below the long-term average but doesn't turn negative.
Looking at the most important events affecting the pair today, attention will turn to the US retail sales, which is expected to rise 0.8% monthly in June from -0.3% recorded in May, and will precede the preliminary readings of the Michigan Consumer Confidence Index for the month of July, expected 49.9 vs. 50.0 previously.
Support and resistance levels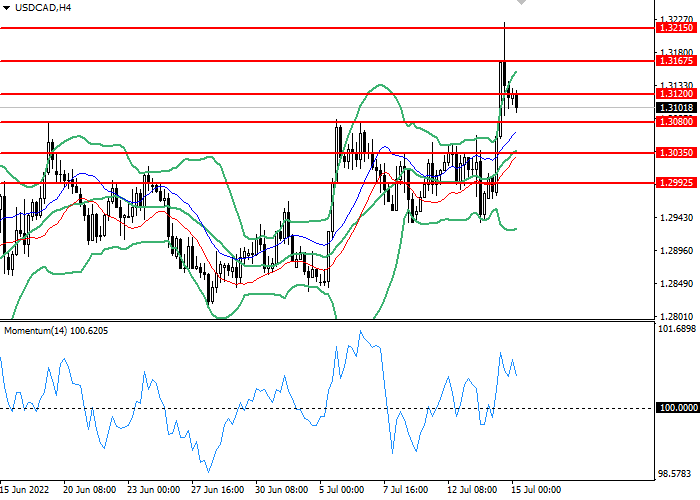
On the 4 hour chart, the instrument failed to consolidate at the upper side of the Bollinger Bands. The indicator is oriented sideways and the price range has shrunk, indicating that the current trend is about to change.The momentum chart is above the 100 level, which is giving sell signals. The Envelopes indicator gives clear buy signals.
- Support levels: 1.30800, 1.30350, 1.29925.
- Resistance levels: 1.31200, 1.31675, 1.32150.
Trading scenarios
- Long positions should be opened at the 1.31200 with a target of 1.31675 and a stop loss at 1.30800. Implementation period: 1-3 days.
- Short positions can be opened at the level of 1.30800 with a target of 1.30350 and a stop-loss at the level of 1.31200. Implementation period: 1-3 days.