Fundamental analysis of EUR/USD
EUR/USD started the week with a decline to $1.09750 amid disappointing German retail sales data and mixed Eurozone economic data.
In terms of Eurozone data, Monday saw the release of July's harmonized consumer price index, which rose 5.5% year-on-year, as well as a flash GDP figure of 0.3% QoQ and 0.6% YoY. Despite a 1.6% y/y increase in German retail sales in June, the monthly figure fell to -0.8%. The ECB, raising interest rates, added 25 basis points to 4.25%, suggesting a pause in interest rate hikes in September as signs of weakening inflation and recession fears emerge. The media's interpretation of today's PMI, especially its sub-components - prices, employment and new orders - could affect market sentiment.
However, the US dollar showed resilience, reaching 102.00 on Tuesday, despite weak US inflation data released last week. annual. Meanwhile, the Chicago PMI for July came in at 42.8 and the Dallas manufacturing PMI improved slightly to -20. Although the likelihood of a Fed rate hike in September has diminished, signs of sustained growth in the U.S. economy remain. Sub-component analysis of the ISM manufacturing PMI may indicate that inflationary pressures are building. Further attention will be focused on the ISM non-manufacturing PMI released on Thursday. Market watchers are eyeing the upcoming US manufacturing PMI data for further guidance.
China's manufacturing PMI for July fell from 50.5 to 49.2, indicating weak demand both at home and abroad.
Investors will pay attention to manufacturing PMI data, unemployment rate in Germany and, above all, to the expected US non-farm payrolls report on Friday, forecasting the creation of 180,000 jobs and a stable employment rate of 3.6%. In particular, further price movement depends on the Eurozone manufacturing PMI, especially from Italy, and the final Eurozone figures are expected to have a significant impact.
Technical analysis and scenarios:
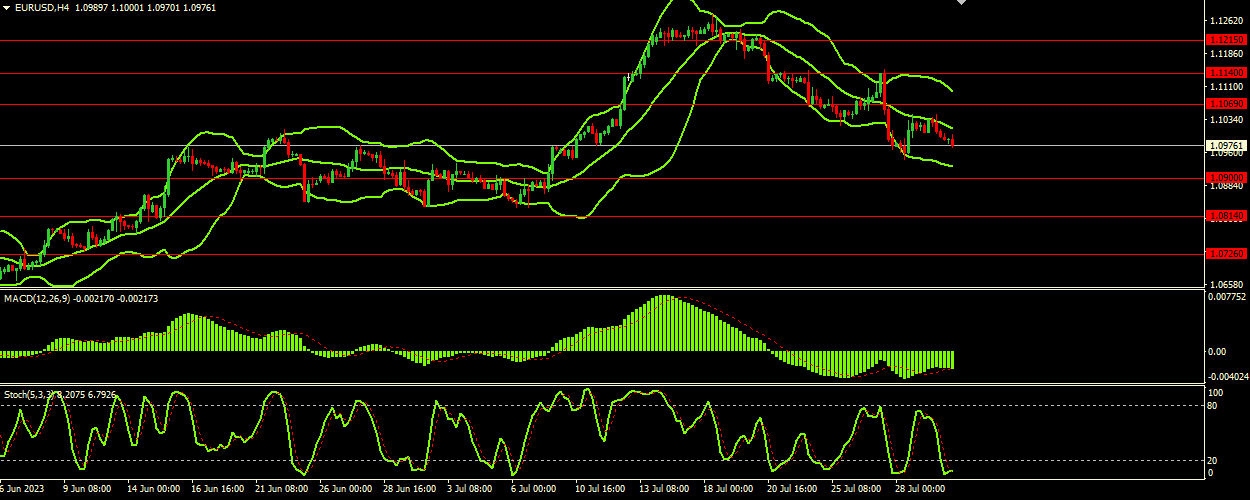
The EUR/USD pair is currently trading at 1.09750, near the 1.10000 support level, and is showing bearish sentiment according to various technical indicators. The Stochastic Oscillator (5,3,3) at 12.4204 and the signal line at 8.1969 are in oversold territory, hinting at a possible bullish reversal. However, this bullish signal should be confirmed by other technical indicators. The Bollinger Bands with middle band at 1.10120, upper band at 1.10990 and lower band at 1.09340 are pointing downwards, indicating a bearish trend. The price is currently in the lower range of Bollinger Bands, indicating that the bearish sentiment remains in the short term. The MACD (12,26,9) value of -0.002032 is below the -0.002158 signal line, further confirming the bearish trend.
Main scenario (SELL)
Recommended entry level: 1.09900.
Take Profit: 1.08140.
Stop Loss: 1.09500.
Alternative scenario (BUY)
Recommended entry level: 1.10690.
Take Profit: 1.11400.
Stop loss: 1.10350.