Fundamental analysis of GBP/USD
Against the backdrop of a busy economic calendar, the GBP/USD pair is showing notable fluctuations. UK retail sales data for July showed a stronger-than-expected decline of 1.2%. On a year-on-year basis, retail sales fell 3.2%, contrasting with June's 1.6% decline, with core retail sales reflecting a similar downward trend. A number of factors, including rainy weather, higher cost of living and rising food prices, contributed to these low sales numbers. Lower retail sales may reduce the need for the Bank of England to tightly manage inflation. Rising interest rates and the current inflationary environment have led to lower consumer spending, which may ease demand-driven inflationary pressures. The UK Consumer Price Index (CPI) fell 0.4% for the month, ahead of market expectations. The core CPI, which excludes volatile components such as oil and food, presents a worrying picture of lingering inflation in the UK, which could prompt the Bank of England to raise rates further.
In the U.S., a decline in jobless insurance claims for the week ended August 12 indicates a strengthening labor market and could lead to another Fed rate hike. The FOMC meeting minutes noted that inflation remains at an alarming level, hinting at the need for tighter monetary policy adjustments to meet long-term inflation targets.
Thus, as the GBP/USD pair remains sensitive to these economic indicators, market participants are looking forward to the upcoming retail sales and purchasing managers' index data. However, market participants may draw inspiration from comments from FOMC members.
Technical analysis and scenarios:
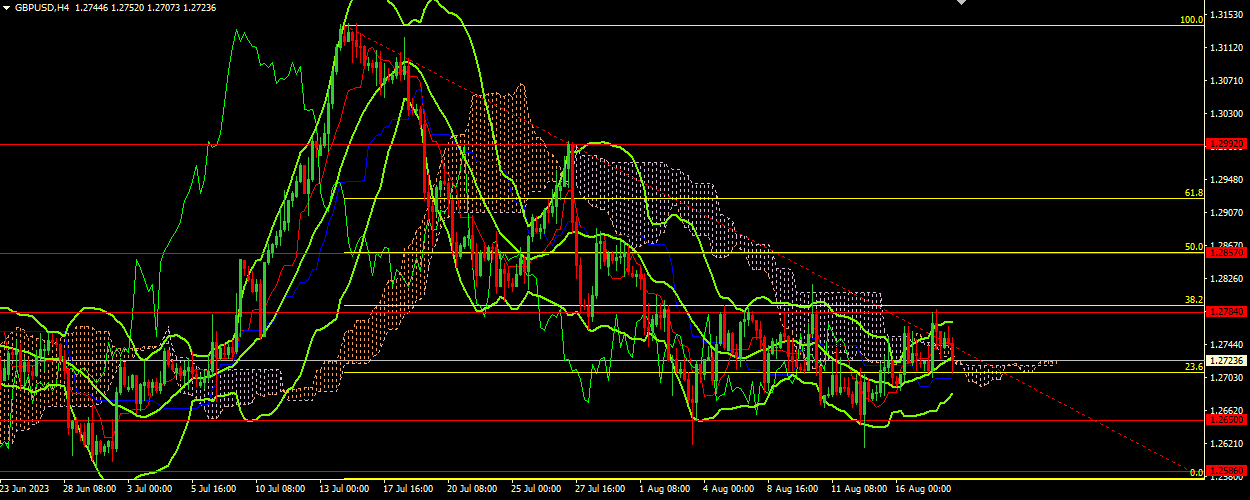
The GBP/USD pair is currently trading at 1.27170, just below the middle band of the Bollinger Bands. Given these support and resistance levels, the pair is closer to the initial support level of 1.26500 and remains below the first resistance level of 1.27840. The Bollinger Bands display the currency pair's movement in the lower range, which often signals a possible increase in volatility. The upward direction of the Bollinger Bands may indicate a potential upward movement, but the current price is trending downward, which emphasizes the importance of watching for possible reversals or continuation of the downtrend.
Main scenario (BUY)
Recommended entry level : 1.27840.
Take Profit: 1.28570.
Stop Loss: 1.27350.
Alternative scenario (SELL)
Recommended entry level: 1.26500.
Take profit: 1.25860.
Stop loss: 1.26900.