Fundamental analysis of EUR/USD
On Thursday, EUR/USD resumed its uptrend for the second day in a row, trading near 1.08620. Much of Wednesday's gains were driven by weak US PMI data.
Economic data from the eurozone was worrisome as the PMI for August fell to 47.0, below the forecast of 48.5. In eurozone leader Germany, the core PMI also fell to 44.7, well below market expectations of 48.3. Meanwhile, France's private sector contracted in the third quarter. In particular, confidence in the French economy fell sharply and there was considerable pessimism in the manufacturing sector.
The US did not escape disappointing economic data. The PMI index fell from 52 to 50.4 in August, which was below expectations. This weak data on the US economy led to a downward revision of US Treasury interest rates and then a bullish correction in the US dollar. The US Dollar Index (DXY), which shows the performance of the US Dollar against six major currencies, is at 103.50. Given the latest dovish GDP and inflation data, many expect the European Central Bank (ECB) to leave interest rates unchanged during the upcoming monetary policy debate. With economic growth slowing in the US, the likelihood of the US Federal Reserve (Fed) raising interest rates in September also seems unlikely.
Both the US and the Eurozone will be in focus following the release of data such as US initial jobless claims and Eurozone GDP. This data, coupled with speeches by Fed Chairman Jerome Powell and ECB chief Christine Lagarde at the Jackson Hole Symposium, should give investors a clear picture of the economic scenario.
Technical analysis and scenarios:
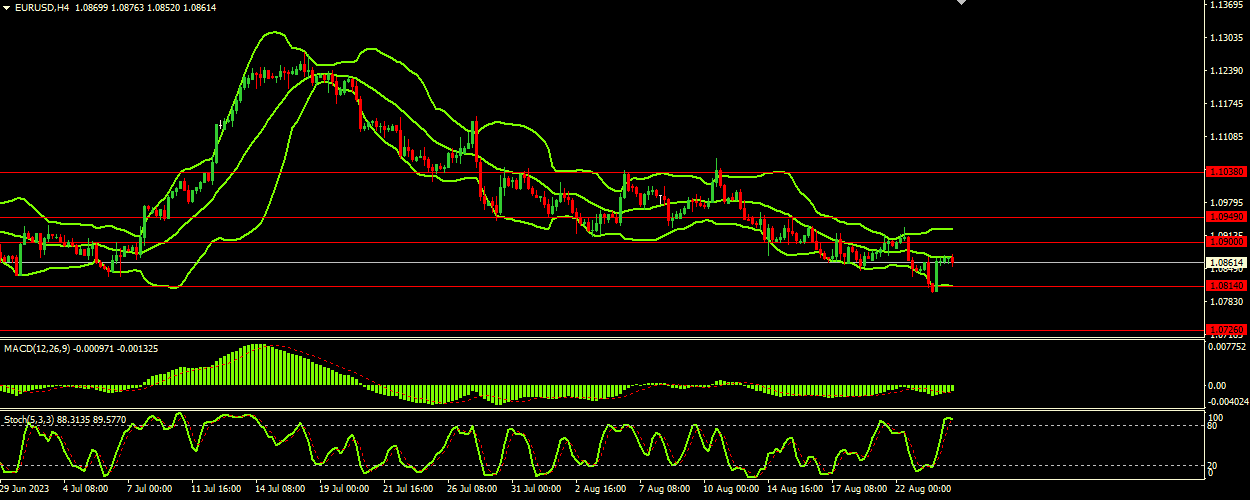
The stochastic oscillator is approaching the overbought area with a value of 87.5344, which is close to the signal line at 89.3173. This may indicate that a pullback may occur in the EUR/USD pair in the near term. Currently, the currency pair is trading in the lower range of Bollinger Bands. The upper band is at 1.09265, the middle (or moving average) is at 1.08715, and the lower band is at 1.08140. The horizontal direction of the bands indicates that volatility remains relatively stable, while the wide price range suggests that large price swings are still possible. The MACD line is slightly above its signal line, indicating potential bullish momentum, albeit weak. The values are near the zero line, indicating that there is no strong momentum in either direction.
Main scenario (SELL)
Recommended entry level: 1.08140.
Take Profit: 1.07260.
Stop Loss: 1.08500.
Alternative scenario (BUY)
Recommended entry level: 1.09000.
Take Profit: 1.09490.
Stop loss: 1.08750.