Fundamental analysis of WTI
WTI crude oil prices are showing uncertainty, fluctuating around the 81.65 level, indicating market caution over future US inflation and employment data. According to the Energy Information Administration, there was the largest inventory decline in the last four weeks, and according to the American Petroleum Institute - the record since September 2016.
The oil situation is characterized by conflicting economic signals. China's manufacturing data fell for the fifth consecutive month, demoralizing the economy and casting a shadow over the outlook for the world's second-largest economy. Nevertheless, traders still have some hope as they await the Federal Reserve's decision and therefore the US personal consumption expenditure data is likely to have an impact on oil demand dynamics. Geopolitical events further complicate the global oil situation. The recent coup in Gabon has further complicated OPEC's supply outlook, while economic growth in the US has been revised down to 2.1% and private sector wage growth is set to slow for the foreseeable future. Against this backdrop, industrial unrest in Australia is shrinking the LNG market, while a shift in geopolitical alliance is changing the dynamics of global oil trade, with India and China becoming the largest consumers of oil from Russia.
In addition, natural disasters such as Hurricane Idalia, which devastated Florida's Gulf Coast, and Hurricane Saola, which threatened major industrial centers in China, including Hong Kong, have exacerbated supply instability. Market sentiment is cautiously optimistic, but points to the possibility of higher prices due to supply constraints and geopolitical implications. However, in this challenging global environment, the balance between supply and demand continues to keep oil prices in a delicate equilibrium. Traders and observers should keep a close eye on economic indicators and global events, as significant changes could determine the future course of oil prices.
Technical Analysis and Scenarios:
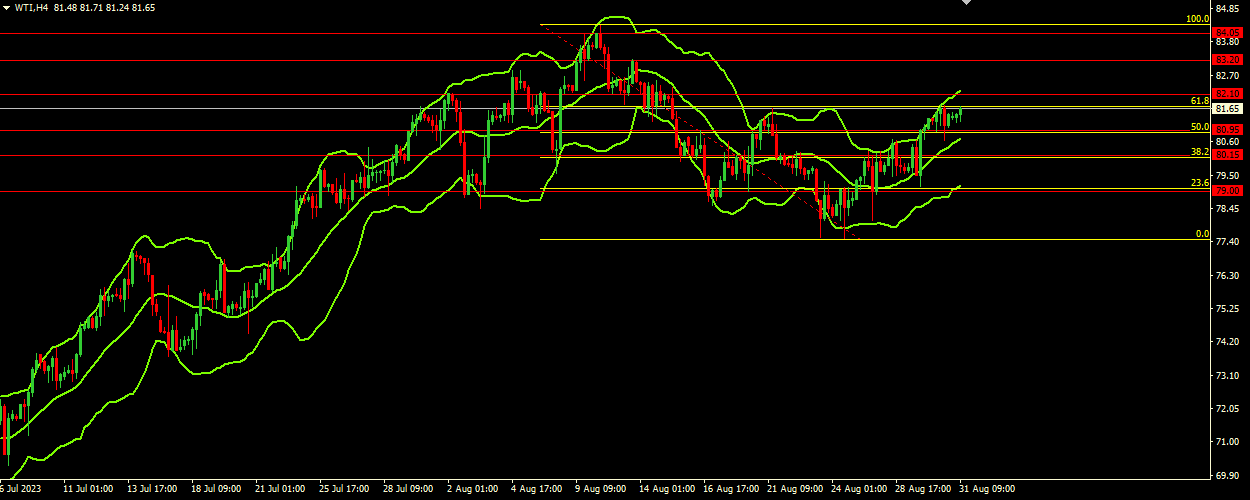
The current price is moving in the upper range of the Bollinger Bands, indicating upward momentum. The upper band at 82.20 serves as immediate resistance. As the price is closer to the upper band and the indicator is pointing upwards, it indicates that the uptrend may continue. Considering the bullish bias of the Bollinger Bands and the price movement.
Main scenario (BUY)
Recommended entry level: 82.10.
Take Profit: 83.20.
Stop Loss: 81.40.
Alternative scenario (SELL)
Recommended entry level: 80.95.
Take Profit: 80.15.
Stop loss: 81.40.