Fundamental analysis of WTI
WTI crude oil prices continued their strong upward trend for the fourth consecutive day, trading at 91.20. This rise is likely due to a combination of factors: a significant decline in US shale oil production and continued supply cuts initiated by Saudi Arabia and Russia.
US oil production is forecast to end October at 9.4 million bpd, the lowest since May 2023. The figure is boosted by promises from Saudi Arabia and Russia to extend production cuts of 1.3 million bpd through the end of 2023. There could be a shortage in the market. However, the future of the oil market has many conflicting opinions. The market has emphasized resilience and minimized the idea that oil demand is about to peak. This optimism is reflected in OPEC's forecast that demand will reach 102.1 million barrels per day this year, a more positive outlook than that of the International Energy Agency.
Challenges remain, however. Concerns about a slowdown in China's economy could slow WTI crude oil prices. The International Energy Agency has warned that production cuts in Saudi Arabia and Russia will exacerbate shortages in the oil market, especially in the fourth quarter. Saudi Arabia's energy minister stressed that OPEC+ is focused on stabilizing the oil market without setting a fixed price target, noting that uncertainty over oil demand from China is a major factor.
Investors and traders are also anticipating future events that could affect the oil market. These include the Federal Reserve's interest rate decision, which is expected to be unchanged, and upcoming oil inventory data from the American Petroleum Institute and the International Energy Agency. In addition, the release of preliminary US PMI data will be of great interest. While the near-term outlook tends to be cautiously optimistic, the overall outlook remains uncertain and investors should exercise caution and adapt.
Technical analysis and scenarios:
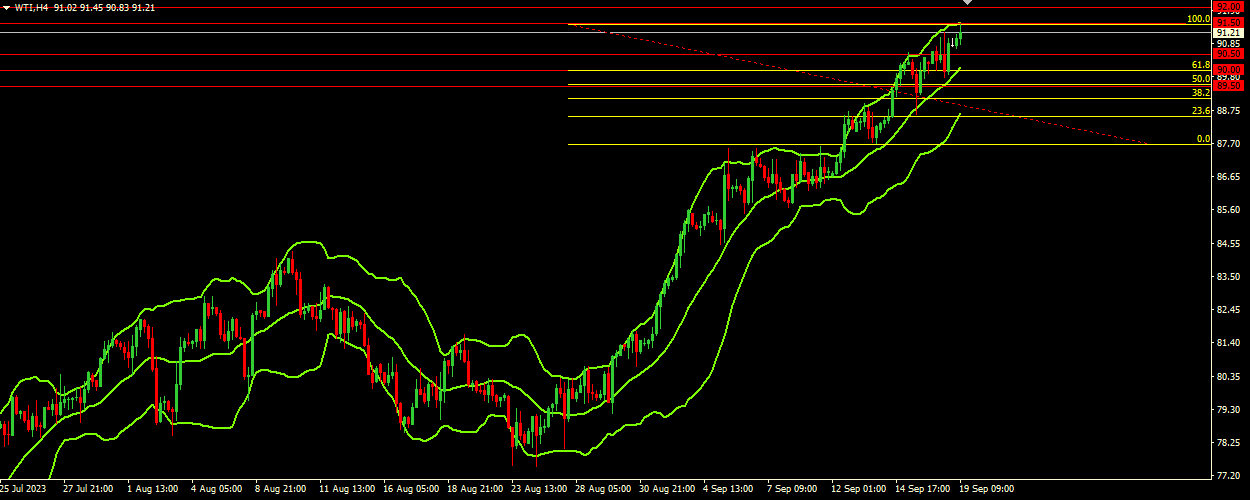
The current price of 91.20 sits above the key support level of 90.50 and is near the first resistance level of 91.50. The upward direction of the Bollinger Bands indicates a bullish trend. The current price is near the upper band at 91.60 and the narrowing of the price range indicates a decrease in volatility. The fact that the price is rising in the upper range of the indicator, especially near the upper band, indicates bullish momentum.
Main scenario (BUY)
Recommended entry level: 91.50.
Take Profit: 92.00.
Stop loss: 91.20.
Alternative scenario (SELL)
Recommended entry level: 90.50.
Take Profit: 90.00.
Stop-loss: 90.80.