Fundamental analysis of XAU/USD
The cost of gold continues its consistent decline and is trading at 1907.00.
Interestingly, this pullback occurred against the backdrop of a weakening US dollar and 10-year Treasury bond yields, which usually support gold prices. The decline in gold prices is attributed to the latest US inflation data, which points to the possibility that the Federal Reserve will pause its interest rate adjustments next week. Digging deeper into these numbers, the Labor Department found that U.S. core inflation rose at an annualized rate at its lowest in nearly two years, hinting at the possibility that the Fed may pause interest rate hikes. In contrast, August marked the largest increase in U.S. consumer prices in 14 months, with a significant contribution from a sharp rise in gasoline prices. With such conflicting indicators, the market faces uncertainty about the Fed's interest rate direction in 2024, which has a significant impact on gold's volatility.
Despite gold's historical appeal as a safe haven, the world's largest exchange-traded fund, the SPDR Gold Trust, saw its holdings fall 0.3%. This slowdown, reflecting falling demand, coincided with a strengthening US dollar, reinforced by inflation data. For investors trading in other currencies, the strong dollar drove up the price of gold. However, while the CPI data was largely in line with market forecasts, it suggested that the Federal Open Market Committee may maintain current levels, which would provide temporary support to prices. Given recent economic developments, market forecasts suggest that the Fed will leave interest rates unchanged at its next meeting. Rising interest rates traditionally increase the attractiveness of US Treasuries, making them preferable to underperforming assets such as gold. As a result, precious metals investors are shifting their concerns from inflation to the opportunity cost of owning gold in a rising interest rate environment. On the contrary, during Thursday's Asian session after the release of the U.S. Consumer Price Index data, gold showed a slight recovery and consolidated at 1910.00.
In addition, the US Dollar Index, which reflects the dollar's exchange rate against six major currencies, seems to be experiencing a slight correction after its recent rally, trading below the 104/65 level. The financial world awaits new economic indicators, particularly the producer price index and retail sales data for August, as this information will be important in determining the economic vitality of the US, the outlook for key rate changes and gold prices.
Technical analysis and scenarios:
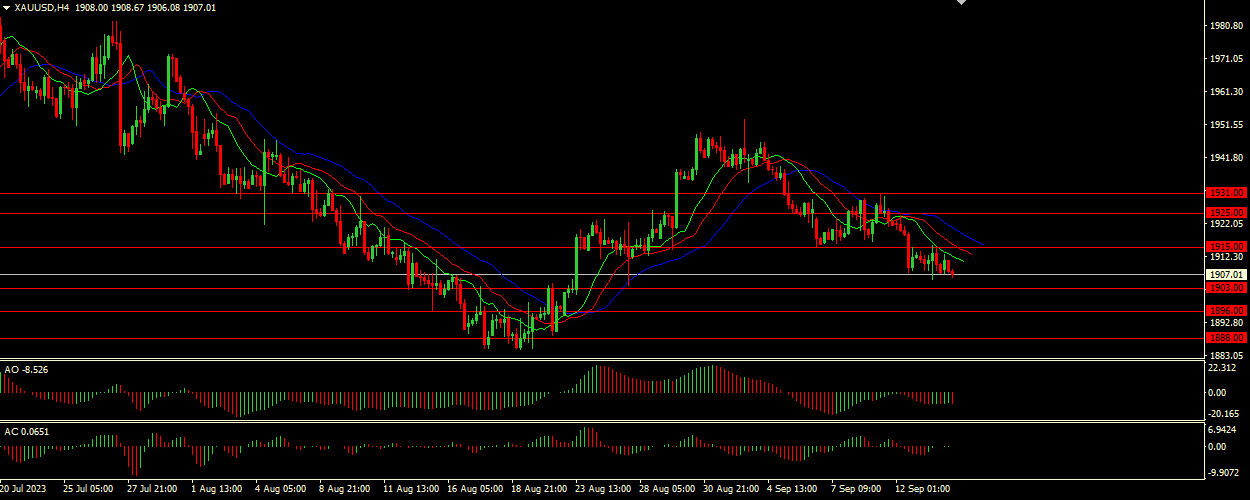
A wide open alligator jaw indicates strong momentum in the current downtrend. A jaw (blue line) well above the teeth and lips (green and red lines) indicates that downward momentum may persist. The Awesome Oscillator (AO) and Accelerator Oscillator (AC) are located in the gray area, showing divergence. Such divergence usually indicates potential uncertainty or weakening of the current trend, which may be a harbinger of a reversal or continuation of the trend, but is not a specific trading signal. Given the bearish Alligator indicator and the AO and AC divergence, the main scenario we expect is a continuation of the downtrend in the short term.
Main scenario (SELL)
Recommended entry level : 1903.00.
Take Profit : 1896.00.
Stop loss: 1910.00.
Alternative scenario (BUY)
Recommended entry level: 1915.00.
Take profit: 1925.00.
Stop-loss: 1910.00.