Fundamental analysis of WTI
WTI crude oil prices, trading around 91.05, have weathered a whirlwind of factors affecting their recent trajectory.
A notable surge in Chinese demand during the Golden Week holiday, marked by a 20% increase in domestic flights compared to 2019, and positive Chinese refinery activity hints at a possible surge in the oil market. This momentum from China comes against a backdrop of tight oil supplies in the US, highlighted by inventories at the Cushing storage facility reaching their lowest level since July 2022. Despite robust economic growth in the US indicating continued fuel demand, a potential market deficit of more than 2 million bpd is expected in the coming quarter.
On the supply side, anticipation for the OPEC+ meeting on October 4 is high, and industry watchers are watching Saudi Arabia's future actions with interest. The kingdom, along with Russia, plays a key role in the ongoing process of reducing supply in the global market. Interestingly, Russia has reiterated its stance on maintaining the ban on fuel exports until domestic market conditions gain stability and OPEC+ negotiations result in a potential increase in supply.
However, not everything is so smooth for the "black gold". The economic situation in the US is ambiguous. While data from the American Petroleum Institute (API) shows a 1.586 million barrel increase in US crude oil inventories recently, data from the Energy Information Administration (EIA) suggests a 2.170 million barrel decline around the same time. Market sentiment is further dampened by concerns about the Fed's trajectory on interest rates. A potential rate hike could increase borrowing costs, which would indirectly impact demand for crude oil. This sentiment is also supported by the confidence of Chicago FRB head Austan Goolsbee that inflation will be managed and the cautious tone of Richmond FRB head Thomas Barkin regarding the interpretation of inflation data.
The backdrop to these dynamics is the weakening of the US Dollar Index, which is currently trading around 105.75, as well as volatility in US bond yields, particularly 10-year US Treasuries. Economic indicators such as stable US GDP at 2.1%, initial jobless claims data and a larger than expected decline in US home sales further complicate the picture. While traders are awaiting the Core Personal Consumption Goods Price Index data, the general mood in the oil market remains cautiously bullish, with traders' attention focused on global supply-demand interactions and critical economic indicators.
Technical analysis and scenarios:
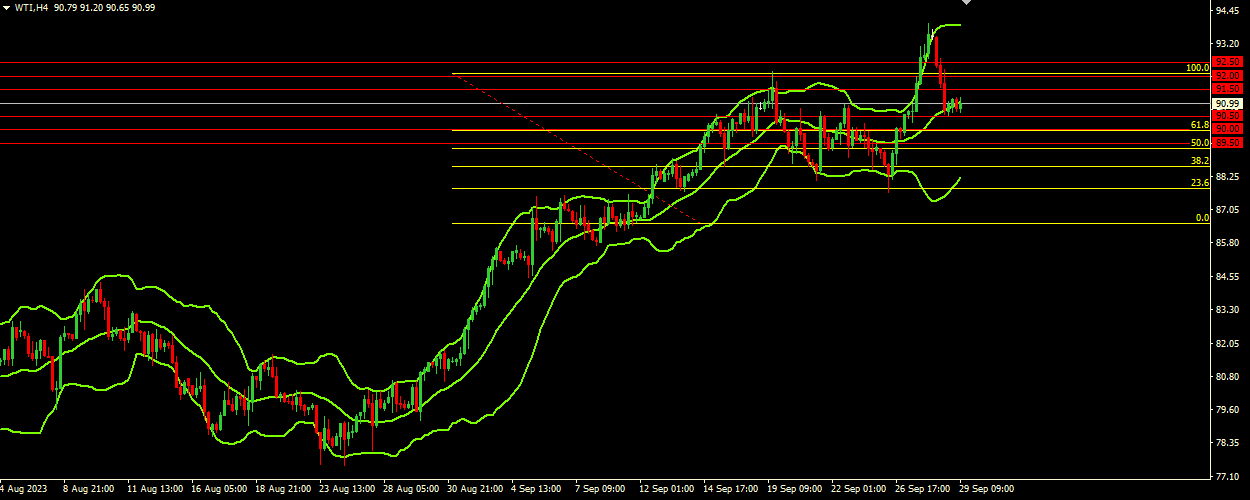
Upper Bollinger band at 91.87, middle band at 91.05 and lower band at 88.20. The direction of the bands is upward and the price range in which WTI is trading is narrowing. The price is currently in the lower spectrum of the Bollinger Bands, near the middle band. Given the current position of the WTI price inside the Bollinger Bands and its proximity to the middle band, we can speak of a bullish bias. The recent narrowing of the price range and the upward direction of the bands indicate potential breakout volatility in the coming days.
Main scenario (BUY)
Recommended entry level: 91.50.
Take Profit: 92.00.
Stop loss: 91.25.
Alternative scenario (SELL)
Recommended entry level: 90.50.
Take Profit: 90.00.
Stop loss: 90.75.