
Gold Price Forecast for Today, Tomorrow, Next Week, and 30-Day Forecast

Gold price forecast and analysis for today, tomorrow, next week and the next 30 days, including key technical levels and market drivers.
Gold is one of the most actively traded financial instruments because of its high liquidity and sensitivity to interest rates, the US dollar, inflation, and global risk. XAU/USD analysis helps traders assess the current market direction, key support and resistance levels, and potential price scenarios.
Key Takeaways
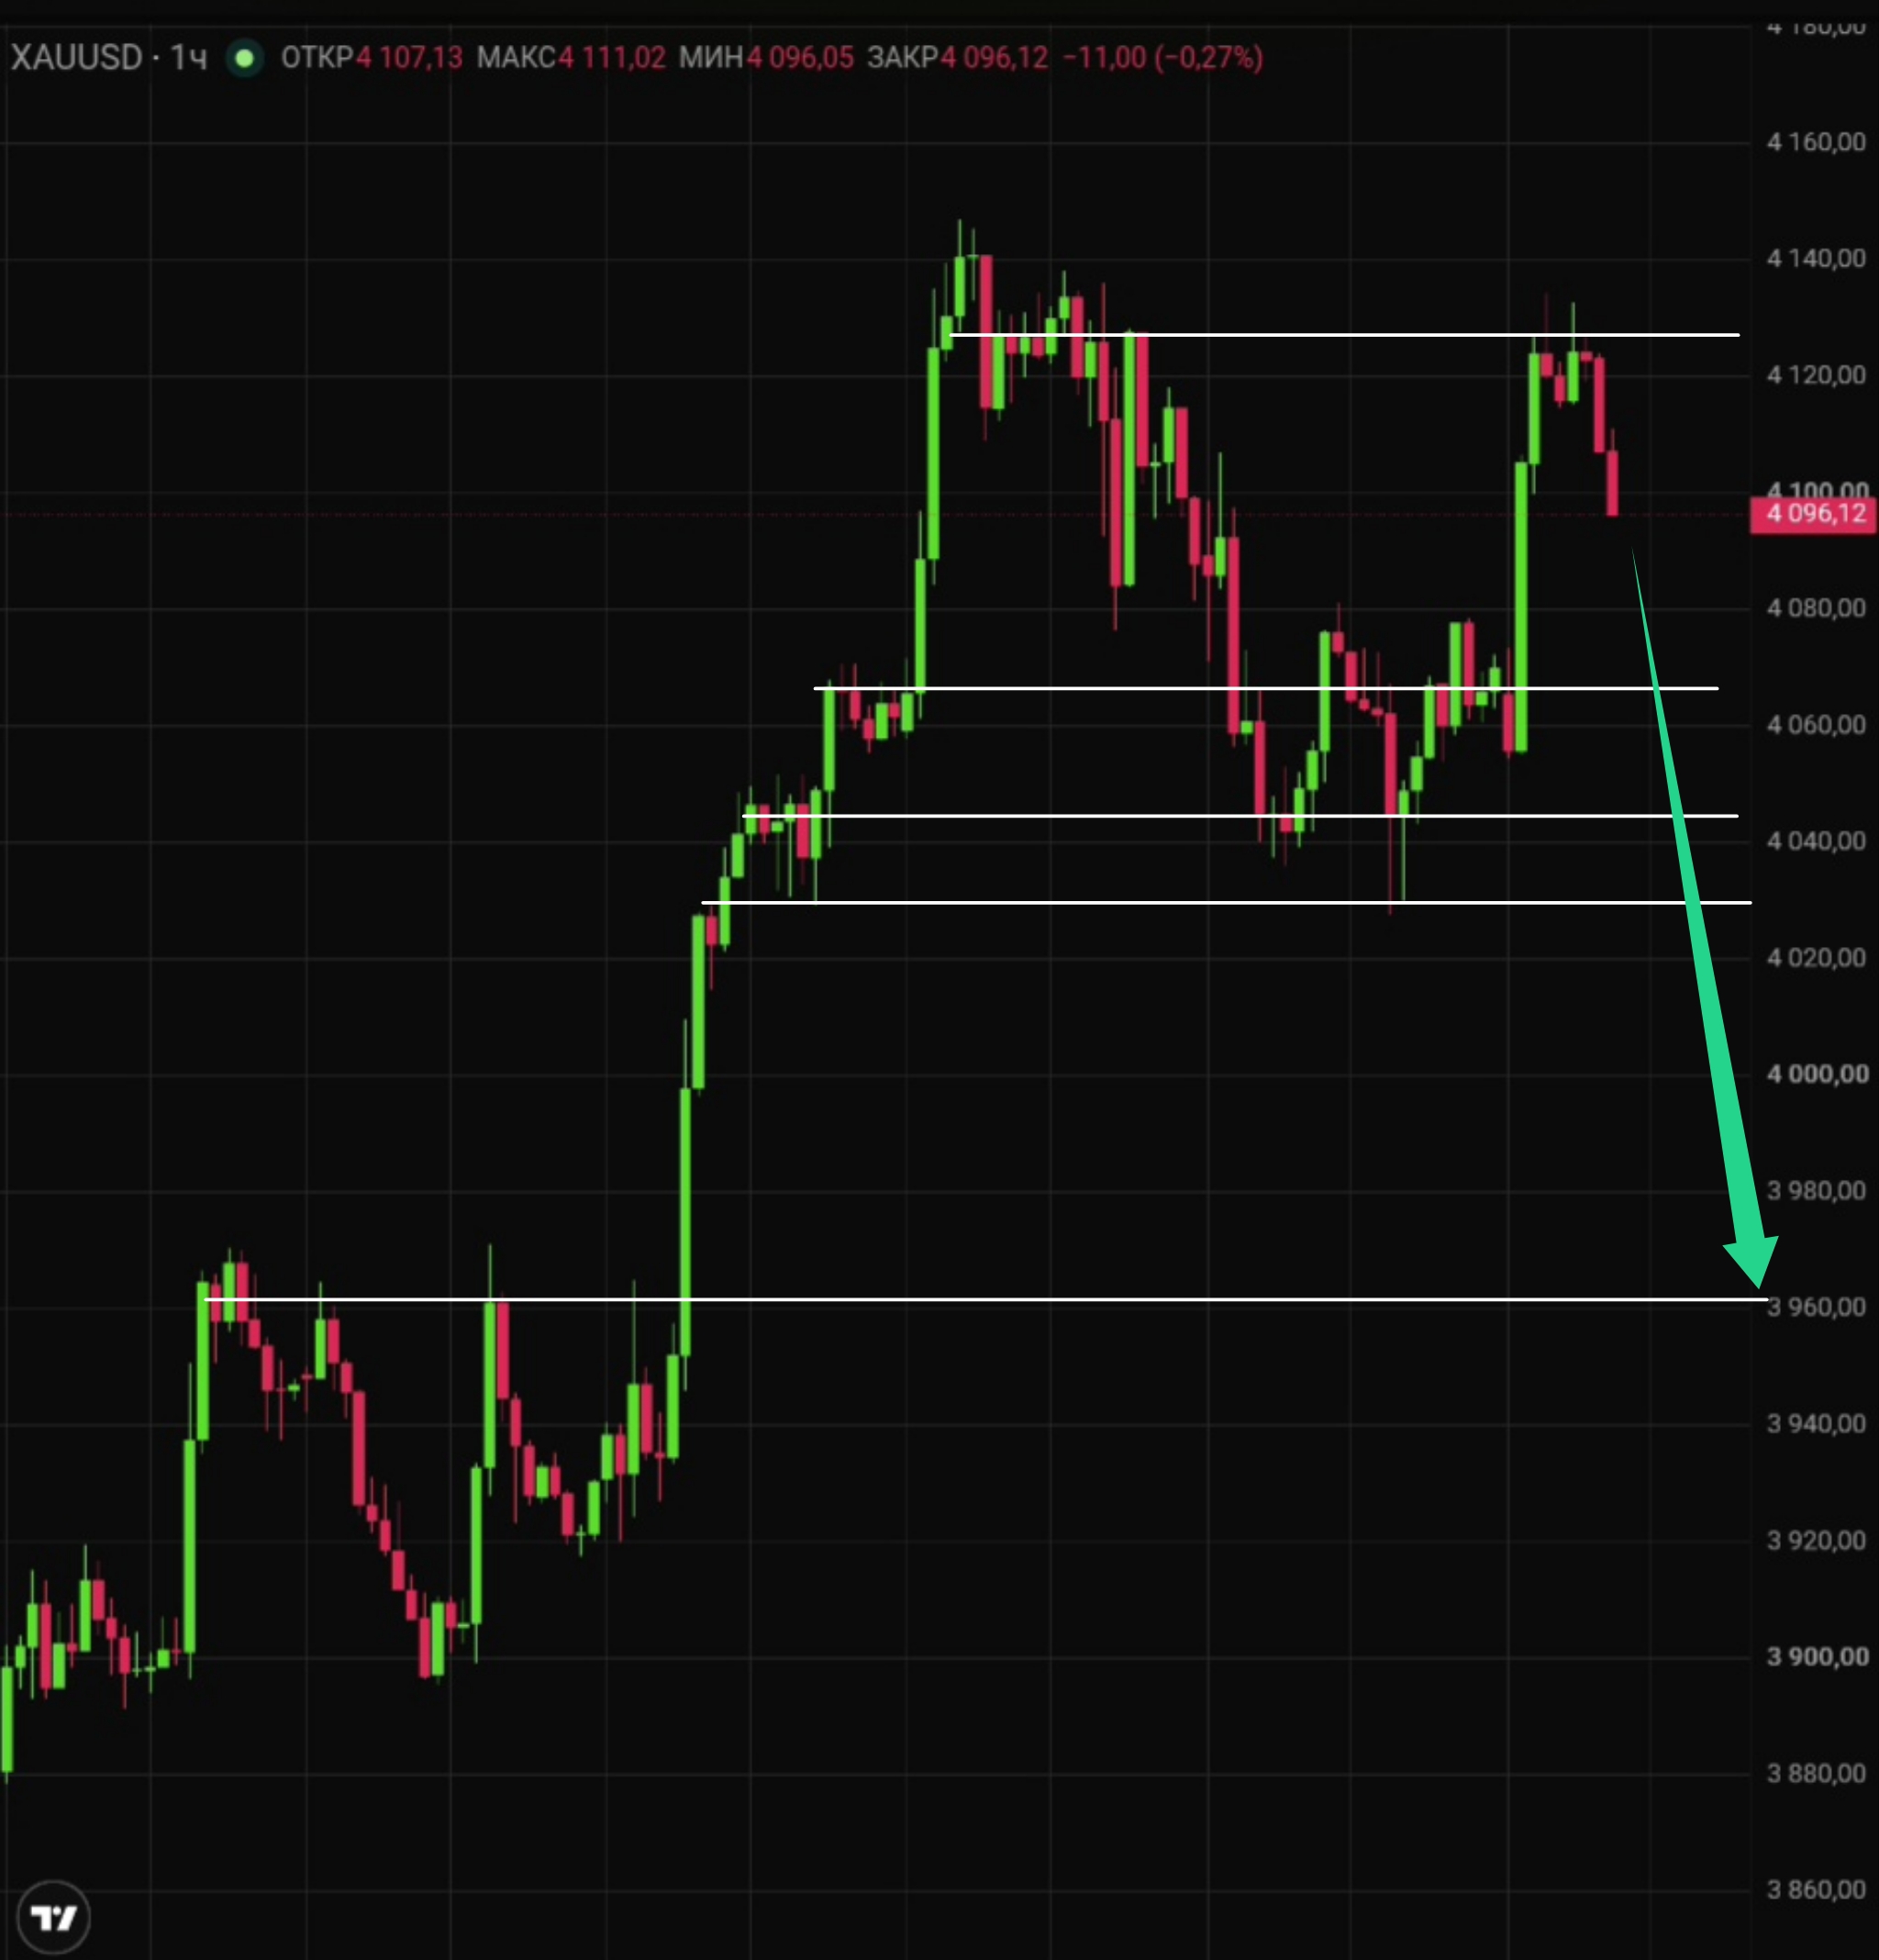
Intraday: Selling pressure is building after a lower local high; a break below the nearest swing low opens a move toward $3,960, with stops best placed above the failed high.
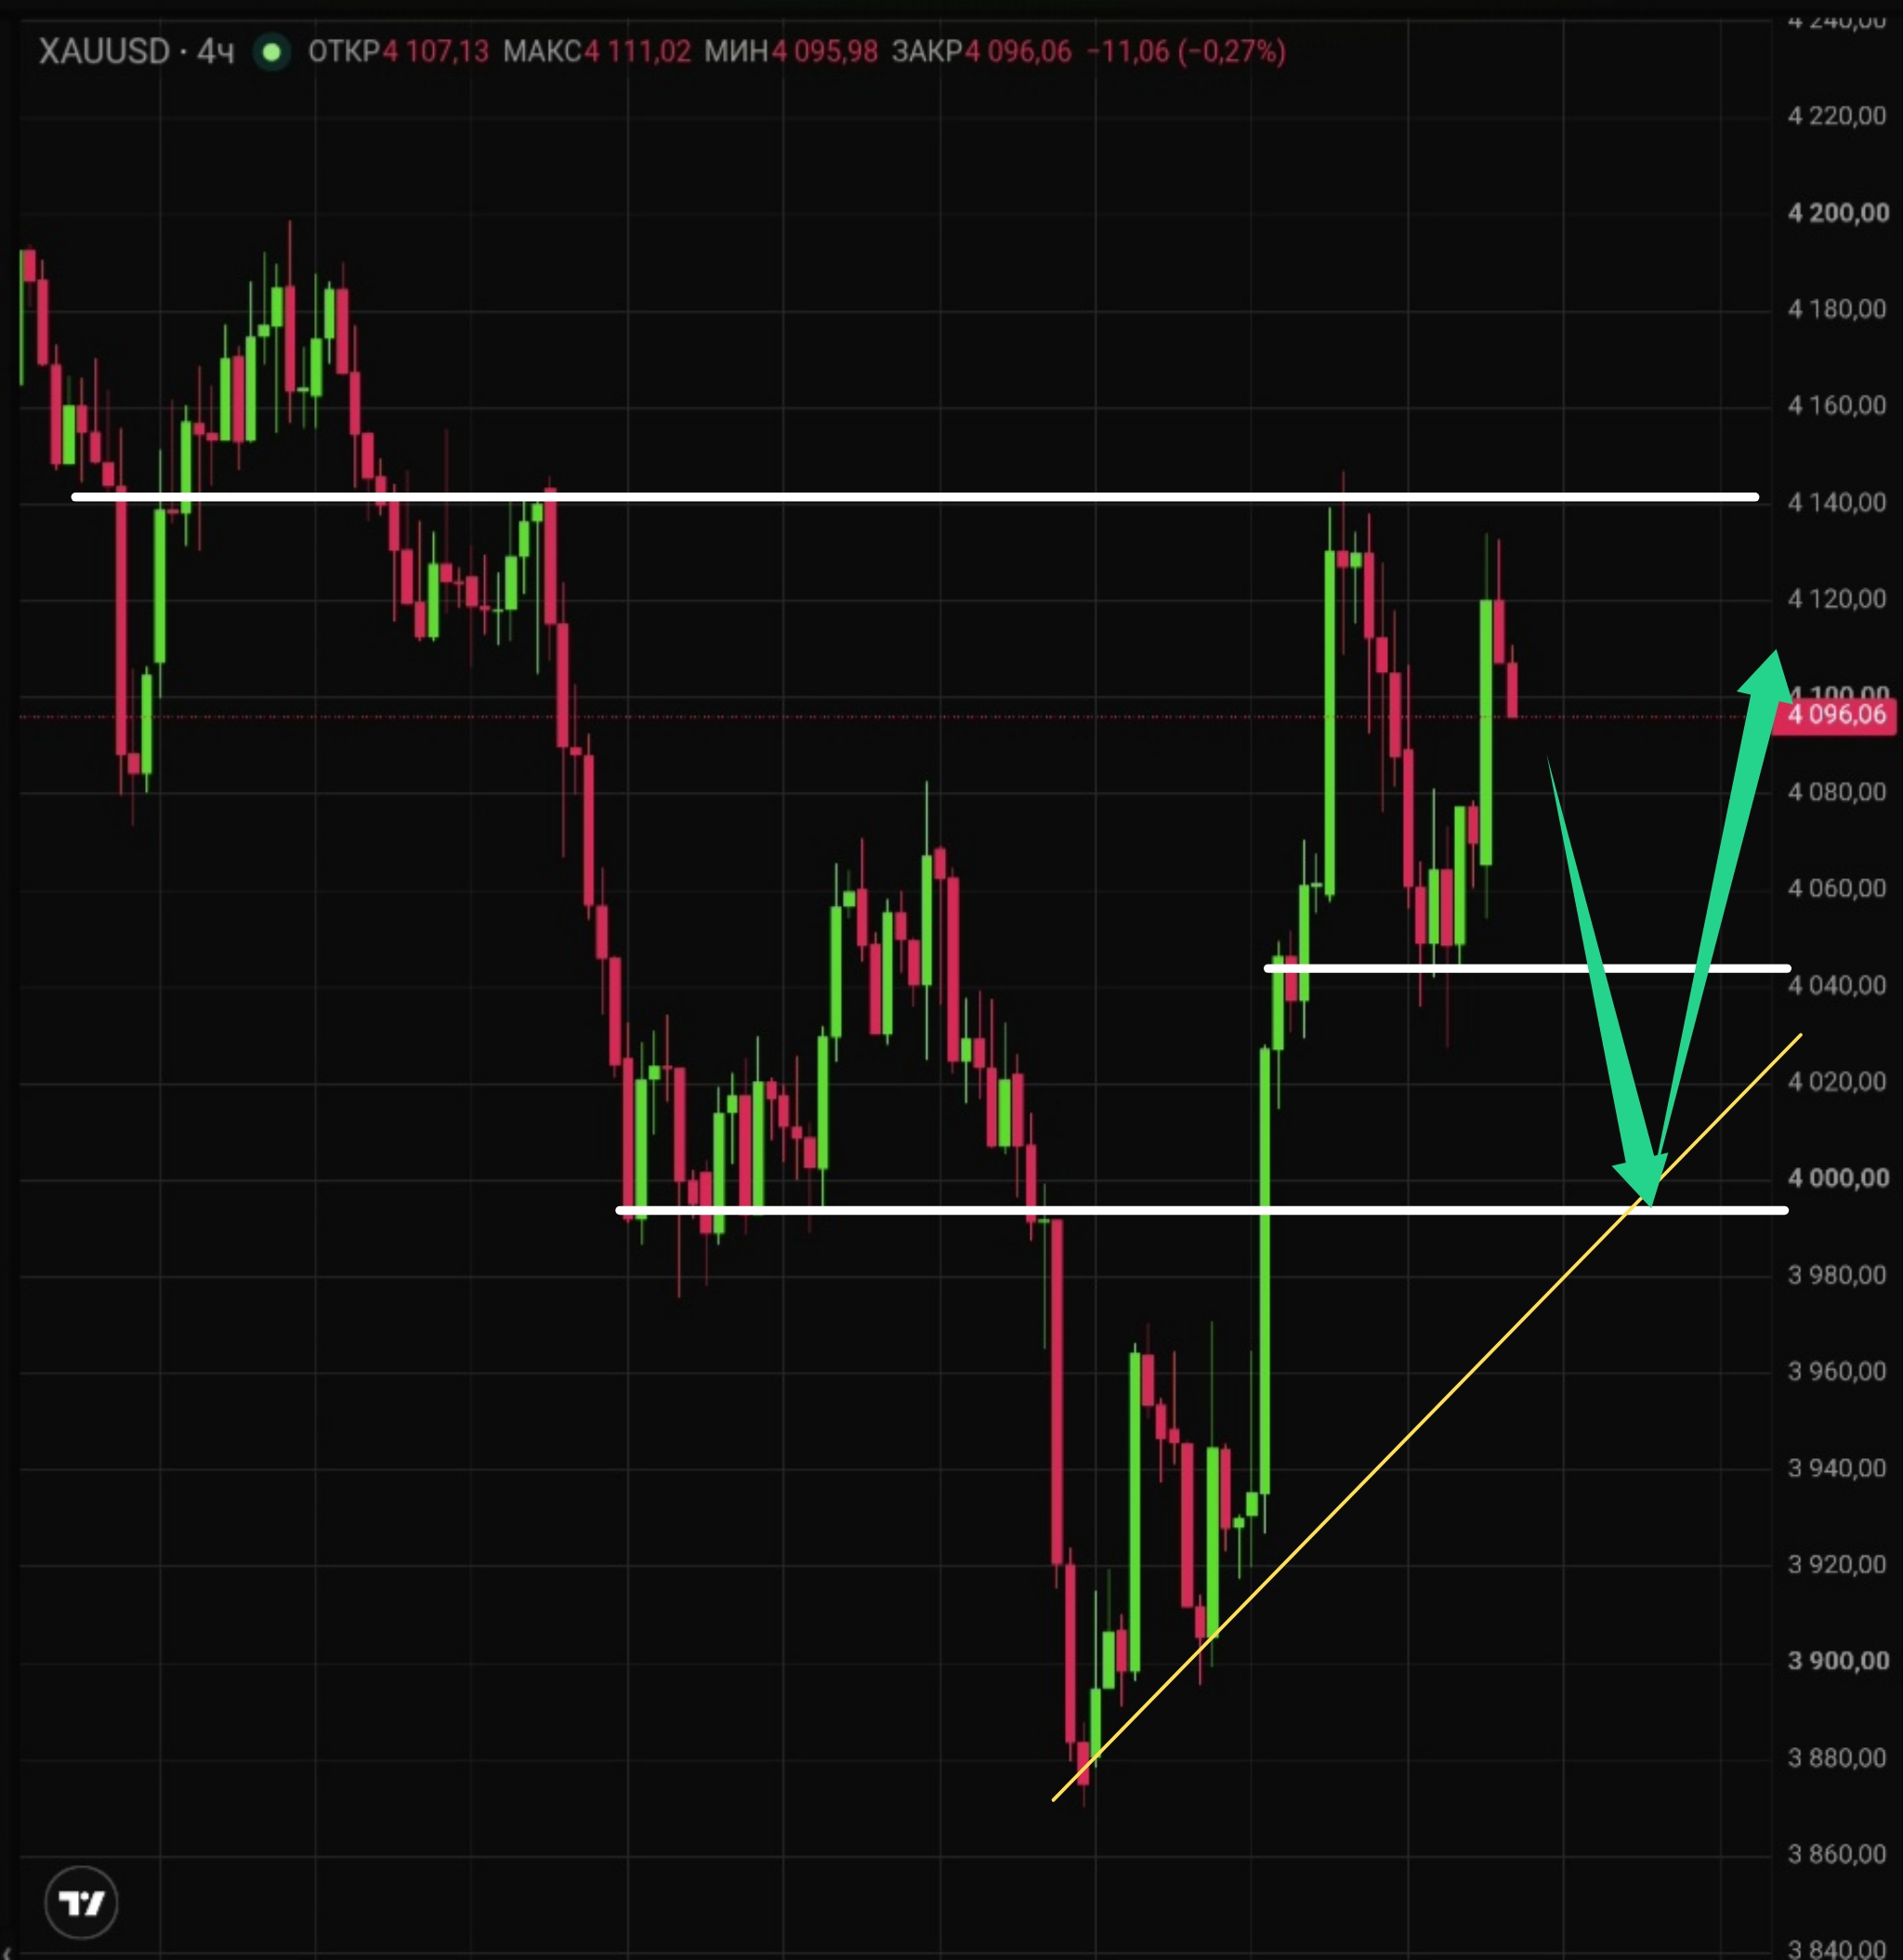
The base scenario: Decline toward the strong demand zone at $4,000 followed by a high-probability rebound.
The alternative scenario: Deeper correction toward $3,960 before any meaningful recovery.
This week: CPI data on 10 November will set the tone; stronger inflation could weigh on gold via higher yields and a firmer dollar.
30-day outlook: Consolidation between $4,000–$4,200 remains the core expectation, with a bullish extension toward $4,100 or a bearish test of $3,900 depending on Fed pricing.
Latest Gold (XAU/USD) Technical Analysis for Today
H1: The latest local peak formed below the previous one, signalling buyer weakness and an inability to push a fresh high. This structure raises the odds of a move below the nearest swing low toward the $3,960 area.
RSI: 50,48
MACD: Bearish
MA: 4,110
H4: A very strong potential demand zone sits at $4,000, where a trendline merges with the round psychological level. An Over&Under reversal pattern has also formed here, making the probability of an upward bounce from this zone extremely high.
RSI: 56,53
MACD: Bearish
MA: 4,086
Key gold support and resistance levels:
- Support: $4,000 / $3,980 / $3,960
- Resistance: $4,100 / $4,130
Gold (XAU/USD) Trading Plan for Today
- Base scenario: Decline toward $4,000 followed by a rebound higher.
- Alternative scenario: Deeper correction toward $3,960 before recovery attempts resume.
- Stops for any long positions from the $4,000 zone are best placed below $3,960.
- Shorts opened on failure of the recent high should be protected above the failed peak.
Gold (XAU/USD) Live Price Today
XAUUSD is trading near $4,100 after recovering from the recent multi-day pullback. The market is waiting for the New York Fed consumer inflation expectations data at 14:00 UTC, which could influence yields and the dollar. A secondary factor is the Bank of England Governor Bailey speech at 17:25 UTC.

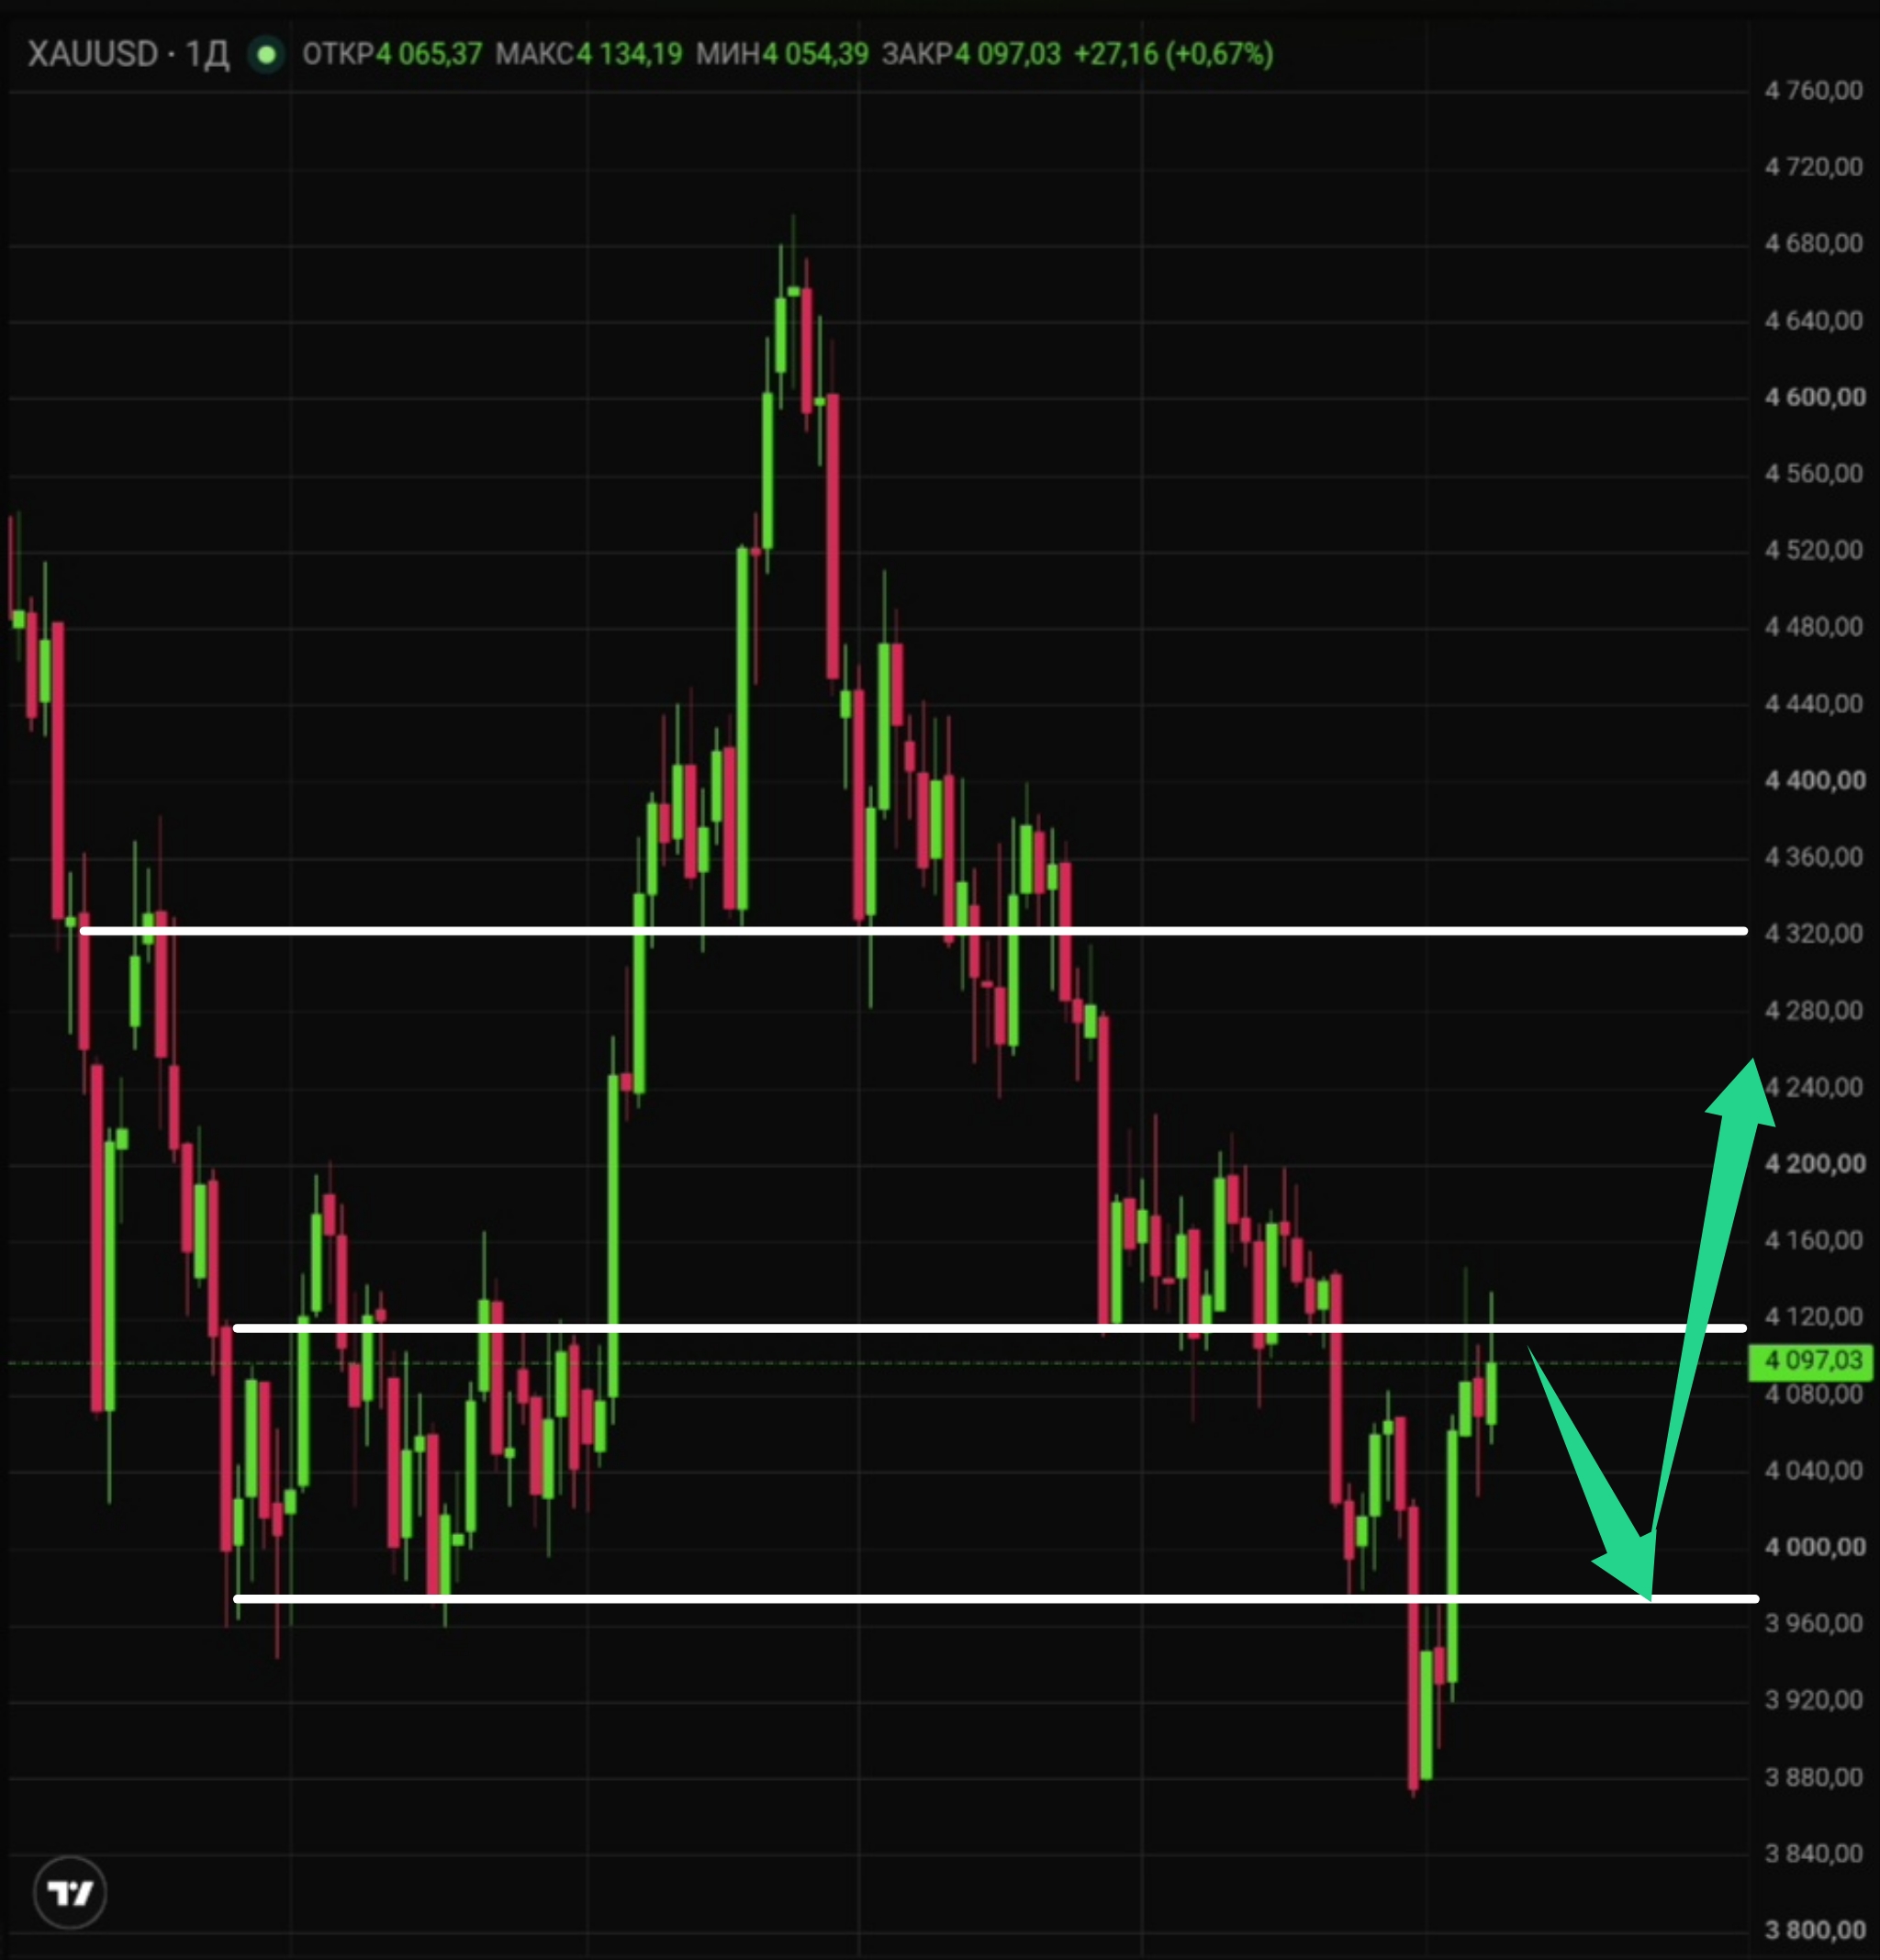
On the daily timeframe, the outlines of an Over&Under pattern are also visible, pointing to potential upside from the $3,960–$3,980 zone.
Gold (XAU/USD) Price Forecast for Tomorrow
Tomorrow's price is expected to begin working the bullish Over&Under pattern from the $4,000 demand zone.
| Date | November 9, 2026 |
| Minimum | $4,050 |
| Average | $4,092 |
| Maximum |
$4,134 |
Will gold go up tomorrow? Yes — the probability of a rebound higher from $4,000 remains elevated.
Gold (XAU/USD) Price Forecast for This Week
Key data releases will drive volatility and shape Fed rate expectations.
- 10 Nov, 13:30 UTC: US CPI (October). Very high – primary inflation guide for Fed policy pricing
- 12 Nov, 13:30 UTC: Initial Jobless Claims. Medium – additional labour-market check
- 13 Nov, 13:30 UTC: US PPI (October). High – producer inflation pressure that can feed into consumer prices
| Date range | November 9–November 13, 2026 |
| Minimum | $4,050 |
| Average |
$4,092 |
| Maximum |
$4,134 |
Focus will be on the reaction of US Treasury yields and the dollar to the CPI print. Stronger inflation could reinforce expectations of tighter Fed policy and pressure gold, while softer numbers would support the metal.
Gold (XAU/USD) Price Forecast for the Next 30 Days
The XAU/USD 30-day forecast centres on successive U.S. data that will shape December Fed expectations. There is no rate decision scheduled in November; the next FOMC meeting with projections is set for 8–9 December.
Key events include:
| Date | Event | Potential impact |
| November 6 | Nonfarm Payrolls | High |
|
November, 10 |
U.S. CPI (October) | Medium |
| November 13 | U.S. PPI (October) | Medium |
| November 17 | U.S. Industrial Production | High |
| November 18 | FOMC Minutes | High |
Direction will be driven primarily by Treasury yields, the dollar, and shifting Fed-rate expectations. Geopolitical risk remains a secondary factor after the recent liquidation wave showed that gold can fall together with equities when liquidity is scarce.
30-Day Scenarios
- Base case: consolidation inside $3,900–$4,100
- Bullish scenario: recovery toward $4,150.
- Bearish scenario: break below $3,800.
Gold Price Analysis and Forecasting Methodology
Our gold forecast methodology combines technical analysis, fundamental analysis, and market sentiment. Technical analysis evaluates price action, trends, support and resistance, RSI, MACD, and other indicators across multiple timeframes. Fundamental analysis considers interest rates, inflation, the US dollar, Treasury yields, and major economic events. Sentiment analysis helps identify changes in investor positioning and risk appetite. The final forecast represents a scenario-based assessment of potential market movements and is not a guarantee of future prices.
Is Gold a Good Investment?
Is gold a good investment? Gold can play an important role in a diversified portfolio because it may provide diversification and help hedge against certain market and economic risks. Investors should consider their investment horizon, risk tolerance, and current market conditions before making an investment decision.
You can start trading gold and other financial instruments with Investizo.
Summary
Gold is testing a high-probability demand zone at $4,000 after forming lower highs on the H1 chart. The Over&Under pattern on both H4 and daily timeframes favours a rebound, yet stronger-than-expected CPI could still push the metal lower toward $3,960. Medium-term focus remains on the $4,000–$4,200 range ahead of the December FOMC.
The trade levels, signals and forecasts in this article are calculated automatically from technical indicators and price history. They are not investment advice or a recommendation to buy or sell any financial instrument. Past performance and forecasts do not guarantee future results. Risk Warning: CFDs are complex financial products traded on margin. Trading CFDs is risky and may not be suitable for all investors. Ensure you understand the risks involved as you may lose all your invested capital.
Gold (XAU/USD) Price Forecast FAQs
What is the current price of XAU/USD now?
November 10, 2026
$
Will Gold Go Up Tomorrow?
Yes. The high-probability Over&Under pattern at the $4,000 demand zone points to a rebound higher. A clean hold of this level keeps the short-term upside bias intact.
Will Gold Rise or Fall Next Week?
The base case is a rebound or consolidation higher from $4,000. Stronger-than-expected CPI could still pressure gold lower, but the technical structure currently favours buyers if the demand zone holds.
What Could Trigger a Short-Term Drop in Gold (XAU/USD)?
A hotter-than-expected US CPI print that lifts Treasury yields and the dollar would be the clearest catalyst. Failure to hold the $4,000 support would also open a quick move toward $3,960.
How Do We Do Gold Technical Analysis?
We analyze price action, trends, support and resistance levels, moving averages, RSI and MACD across H1, H4 and higher timeframes. Major events that can affect XAU/USD volatility are also considered.
How to Trade Gold Technical Analysis?
Technical analysis can help identify potential entry points, targets and stop-loss levels. A trading setup should be based on confirmation of the market scenario and predefined risk rather than a single indicator.
Nikolai Krishtopov is a Market Analyst at Investizo with more than 15 years of experience in the financial markets industry and over a decade of trading experience. His areas of focus include forex and crypto markets, technical analysis, intraday trading and market behaviour.
Award history
More about awards
2023—2026 - 10 awards archived